
See where vx spends its time
A table of vx’s own stages, so a slow run points at its cause.
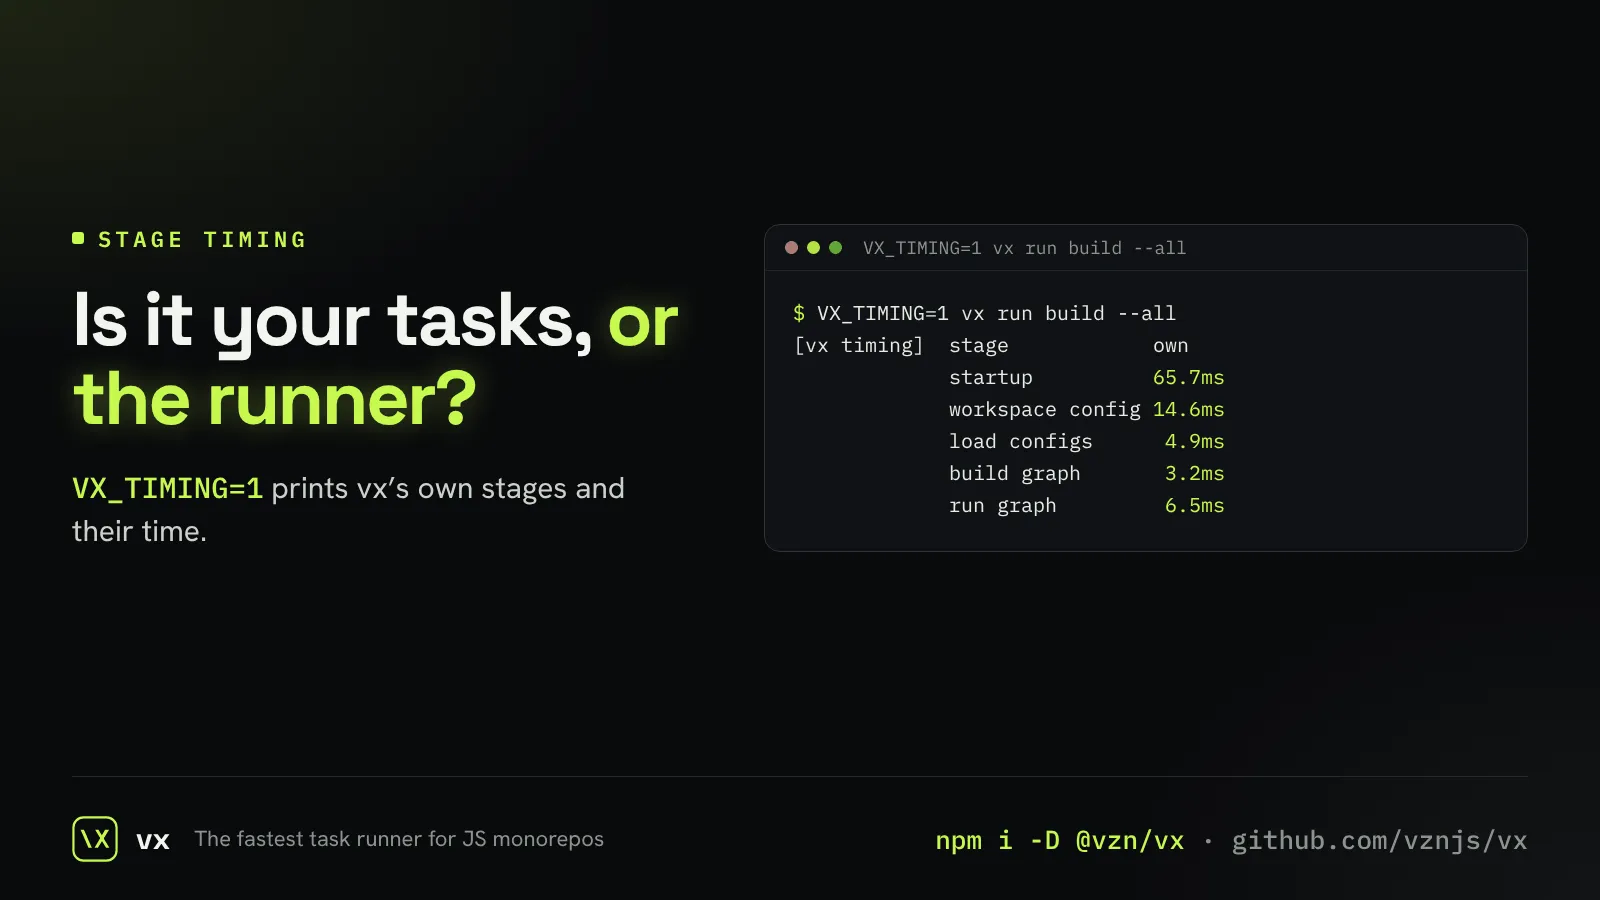
When a run feels slow, the question is whether it is your tasks or the runner. VX_TIMING=1 prints how long each of vx’s stages took.
The same table is how vx’s own speed work is measured, so a report from you is one we can act on.
More in Output that fits
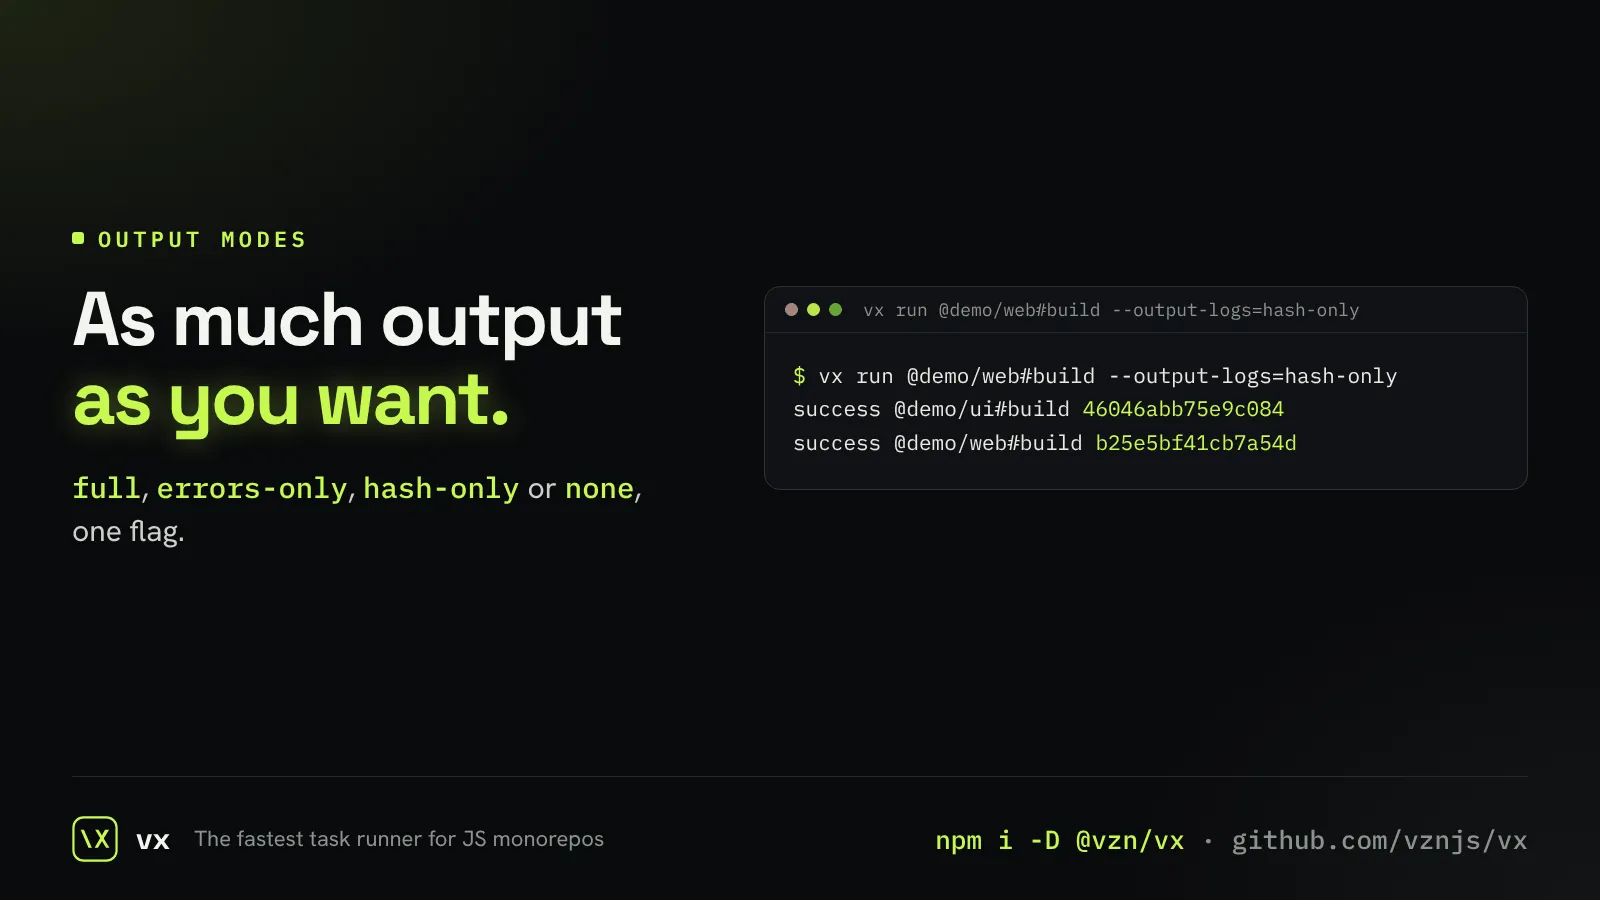
Choose how much you see
Full logs, errors only, just the hashes, or nothing.
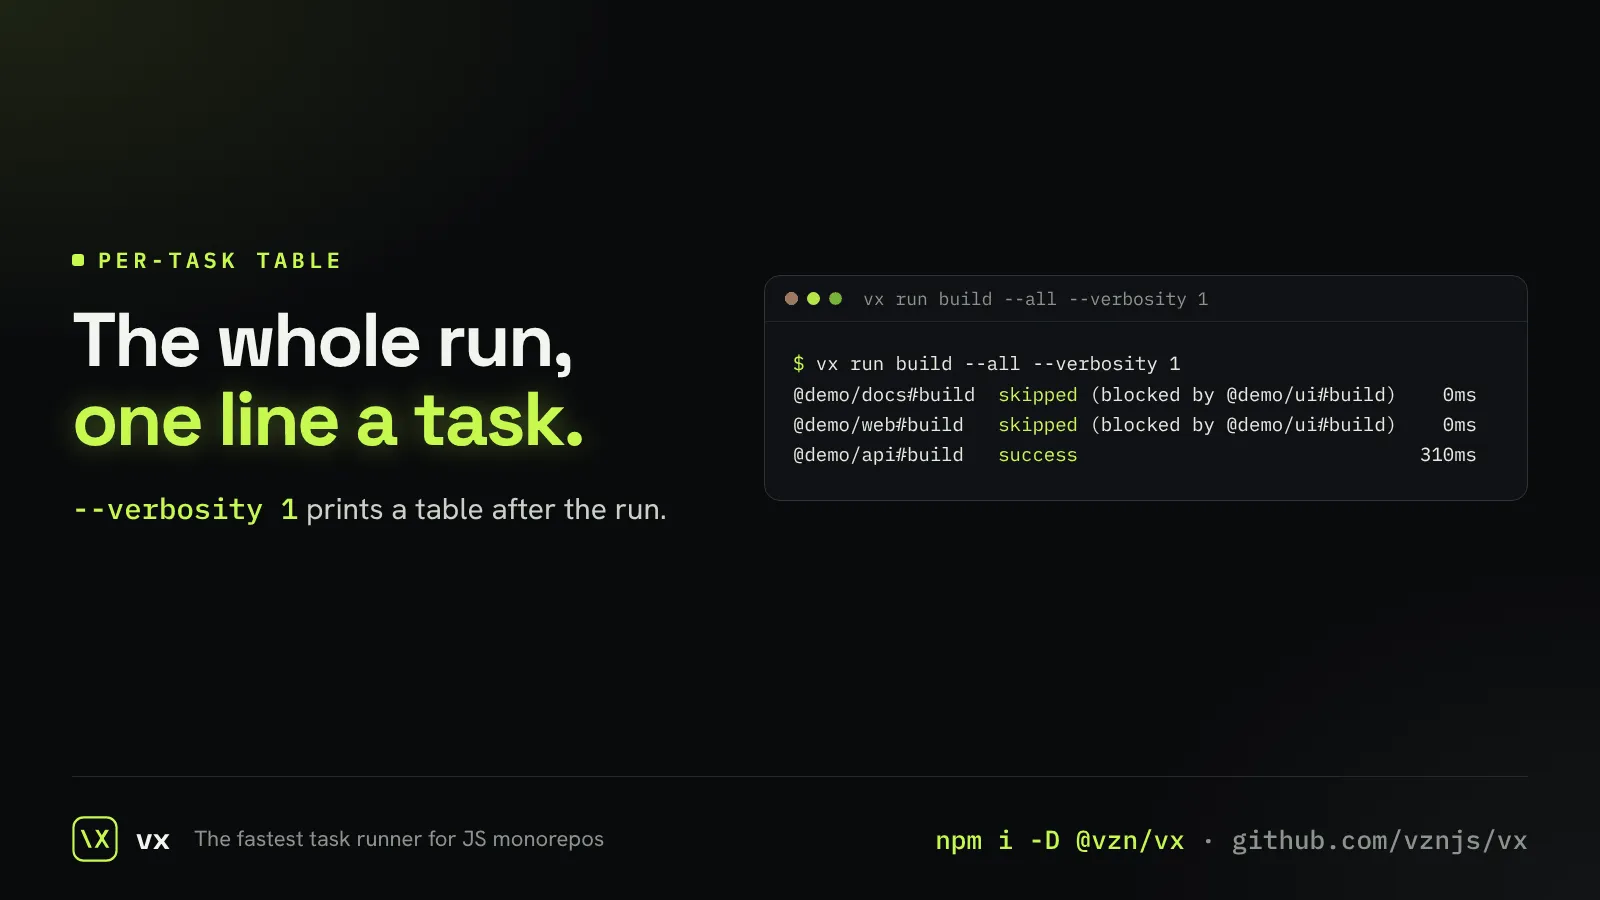
A table of every task
One line per task at the end: what happened and how long it took.
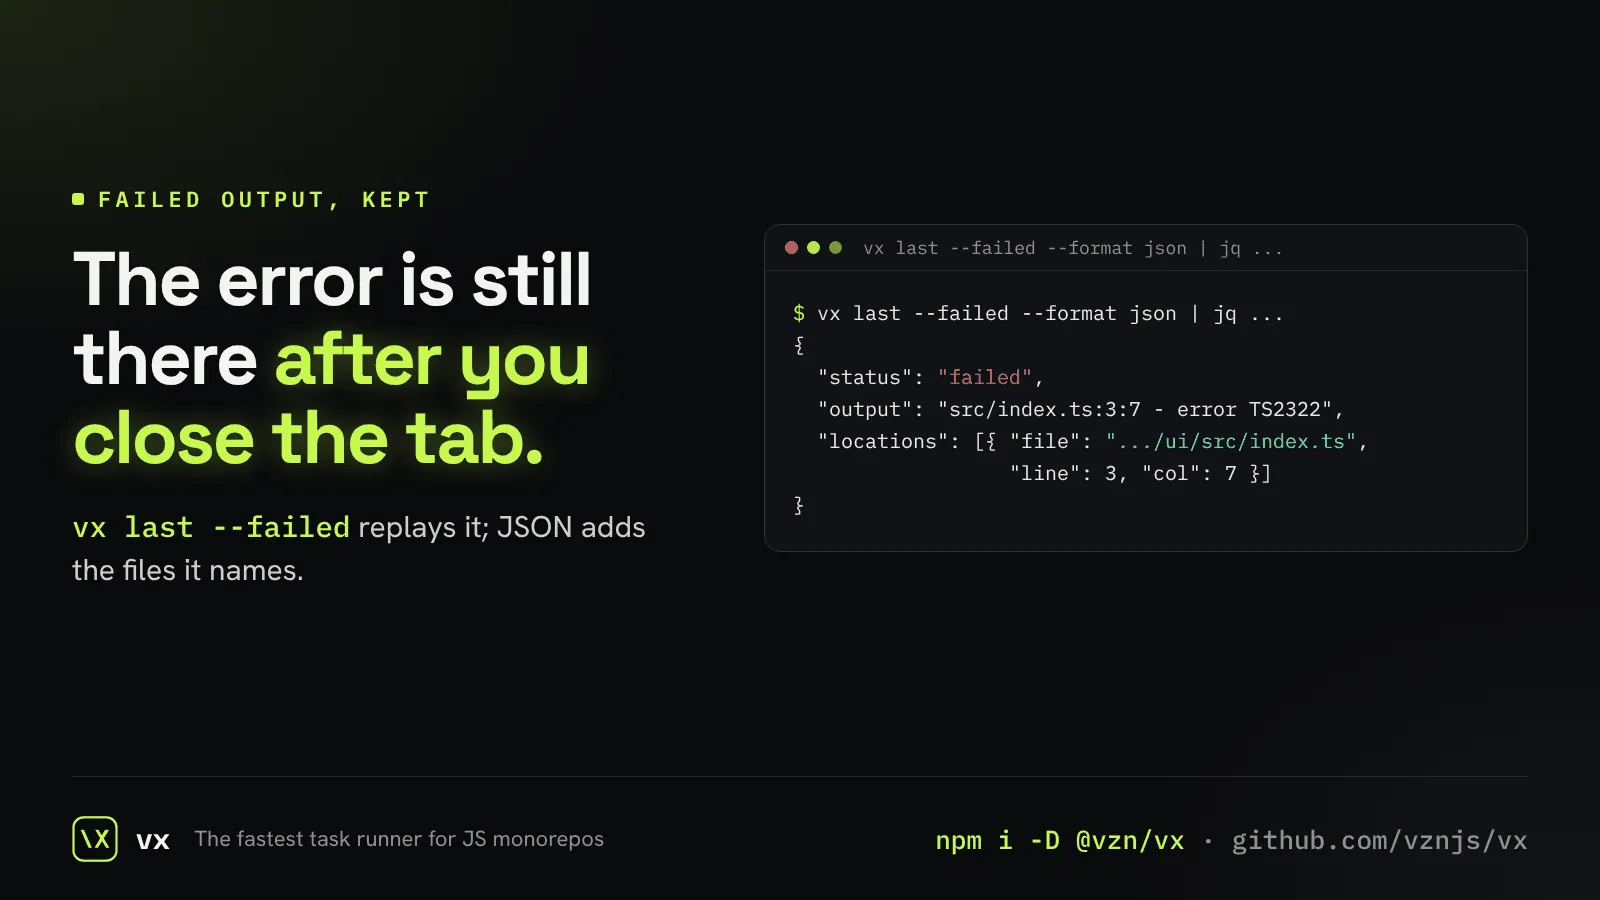
Failures kept for later
A failure’s output is saved, so you or an agent can read it after the terminal is gone.
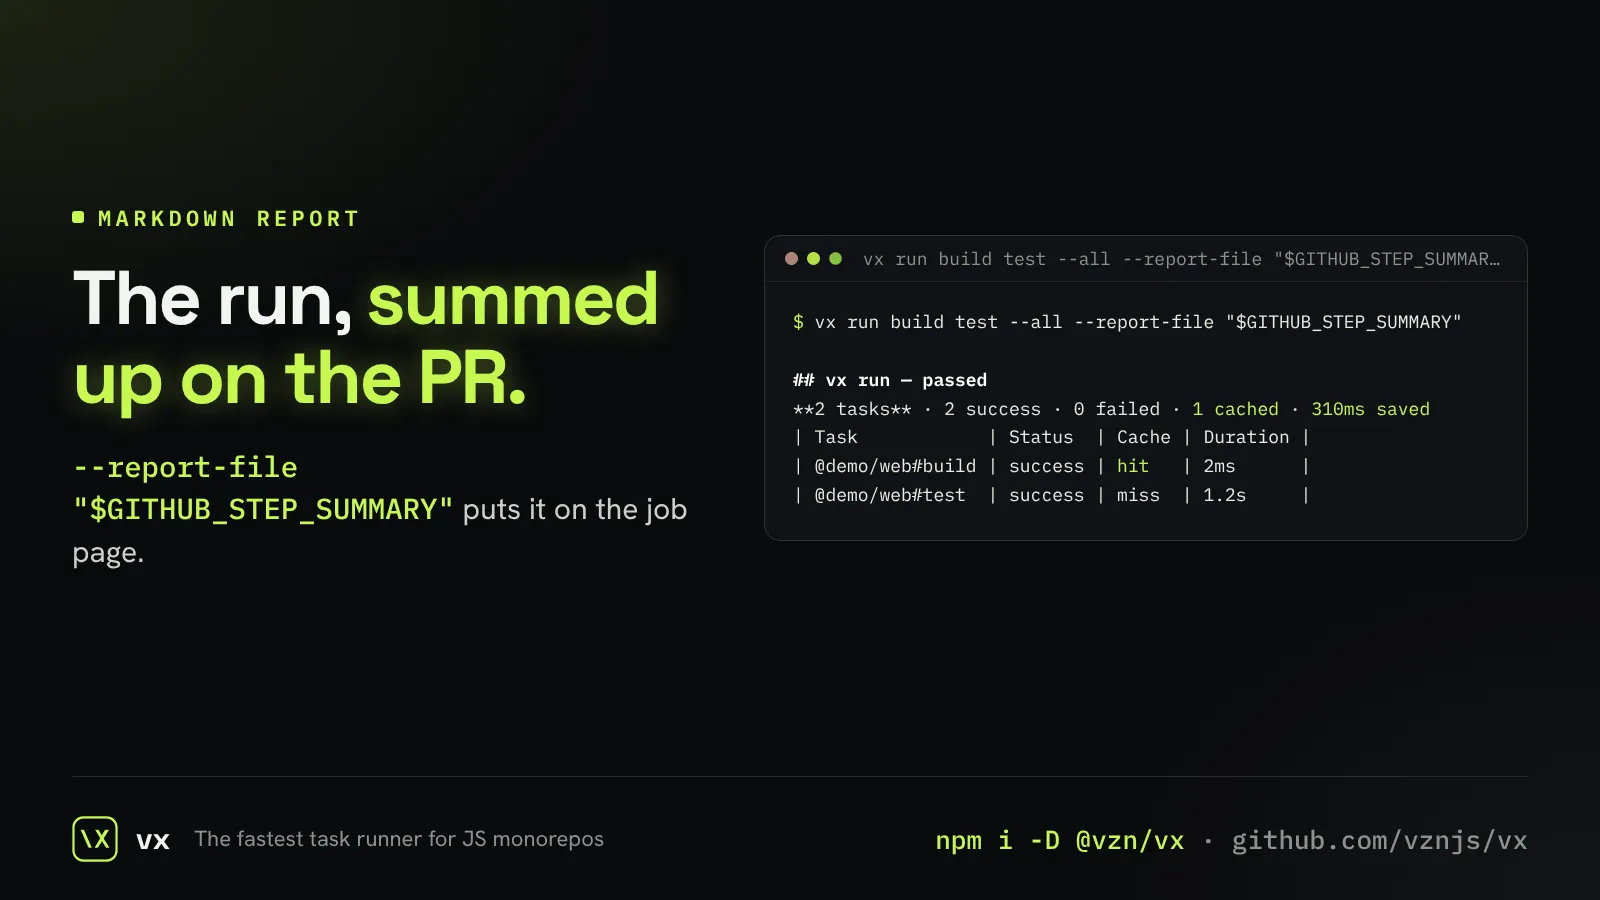
A run report for your PR
A short markdown report of the run, ready for a pull request or a job summary.
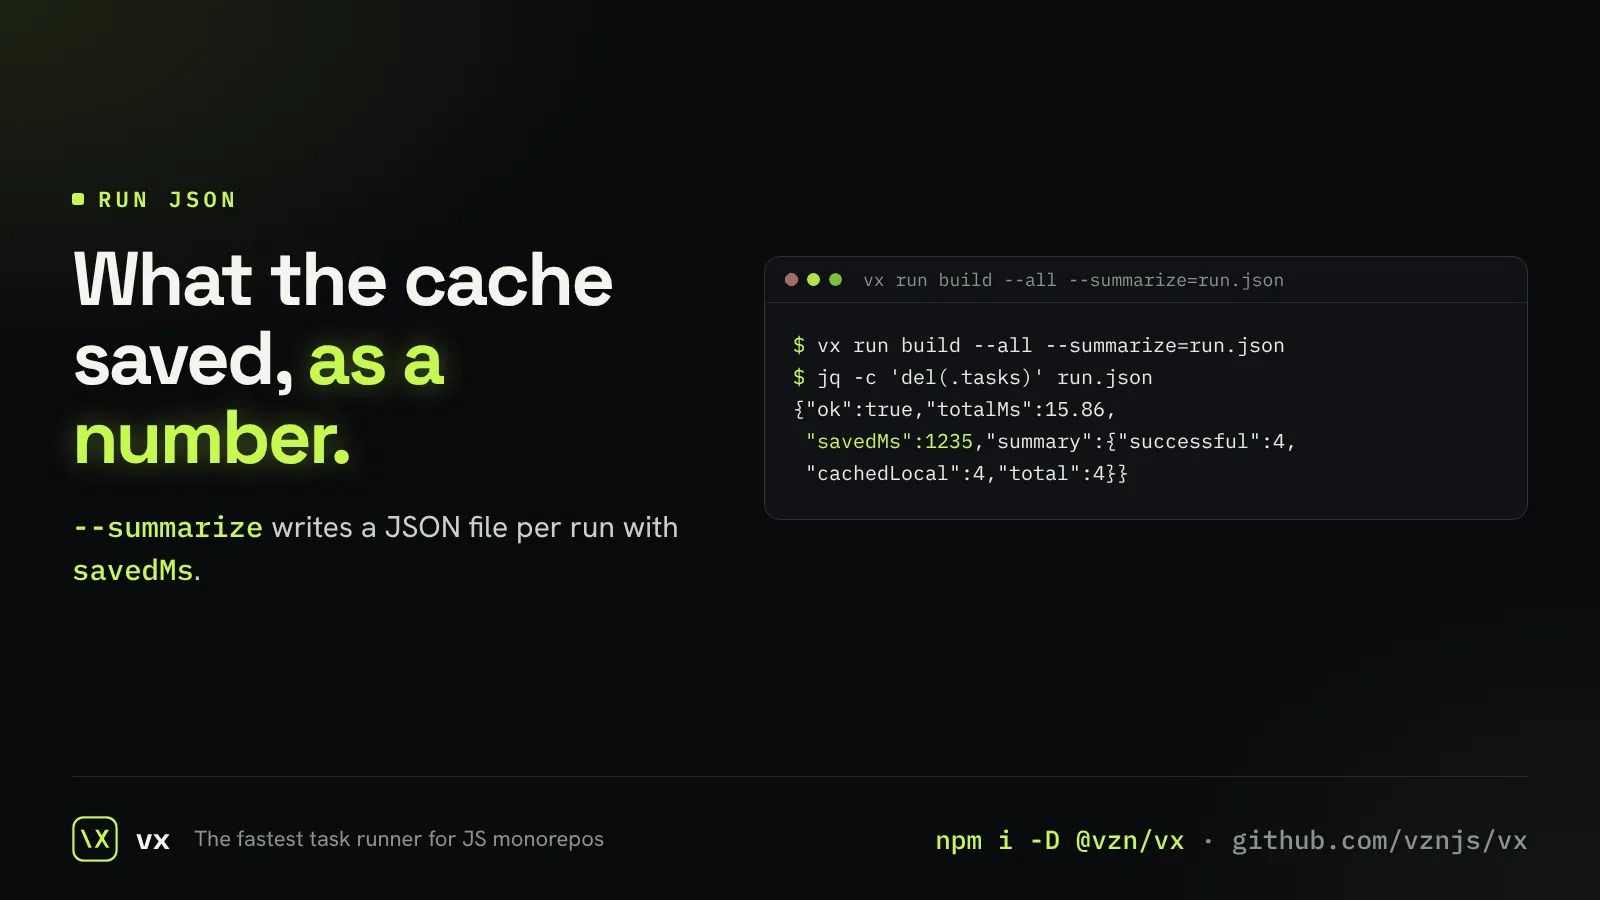
Every run as JSON
A JSON file per run, with each task’s result and the time the cache saved.
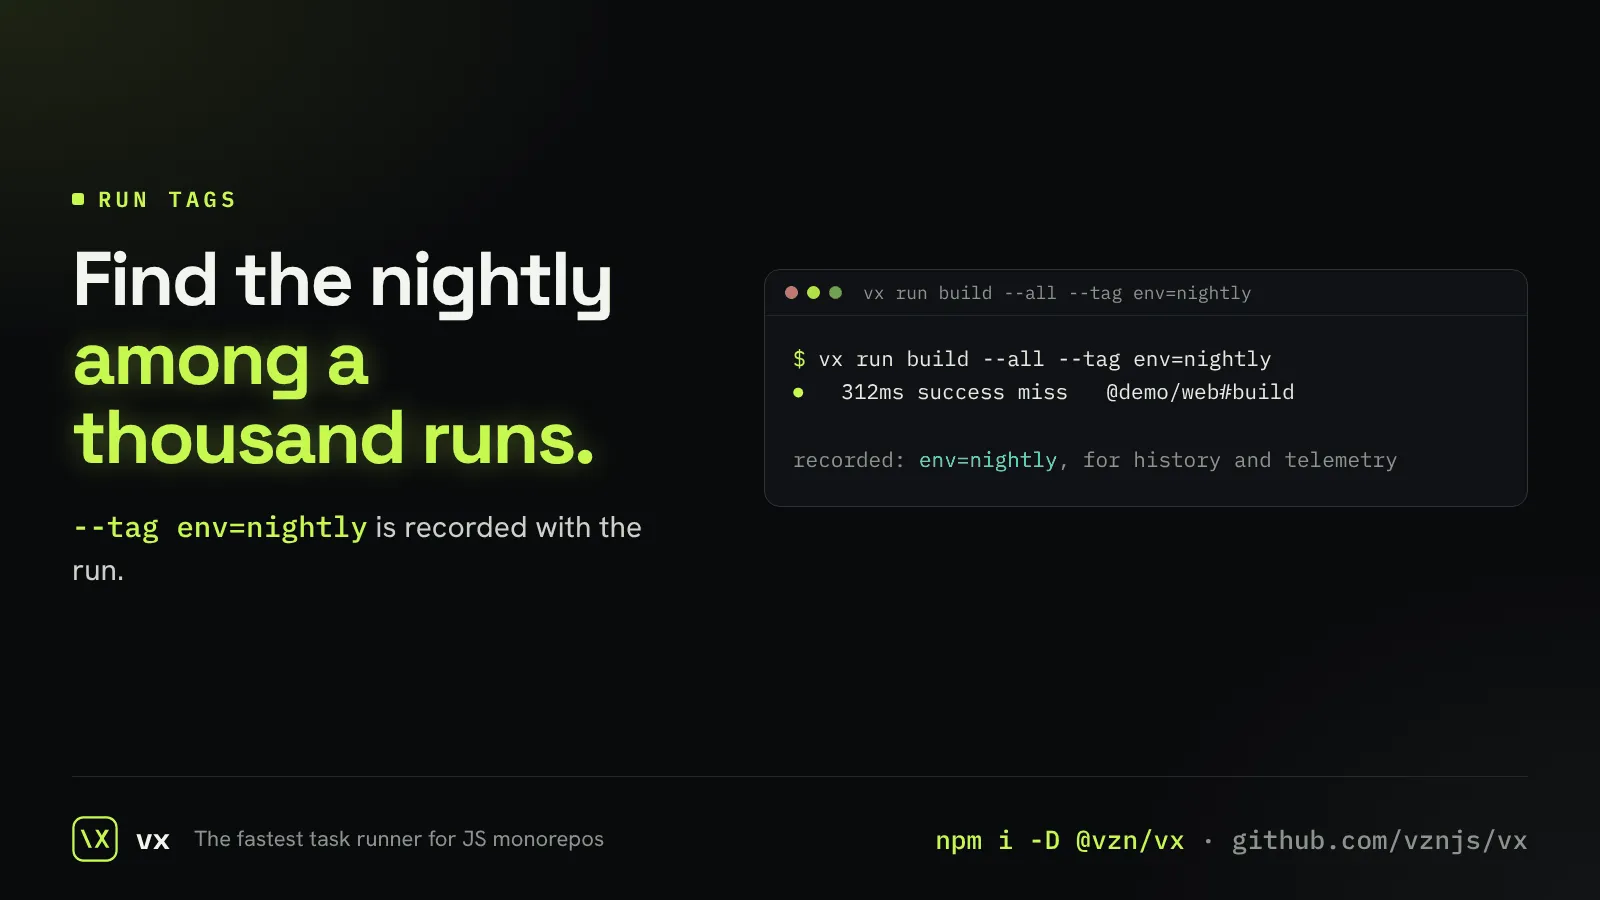
Label your runs
Tag a run, like env=nightly, and find it again in history and dashboards.
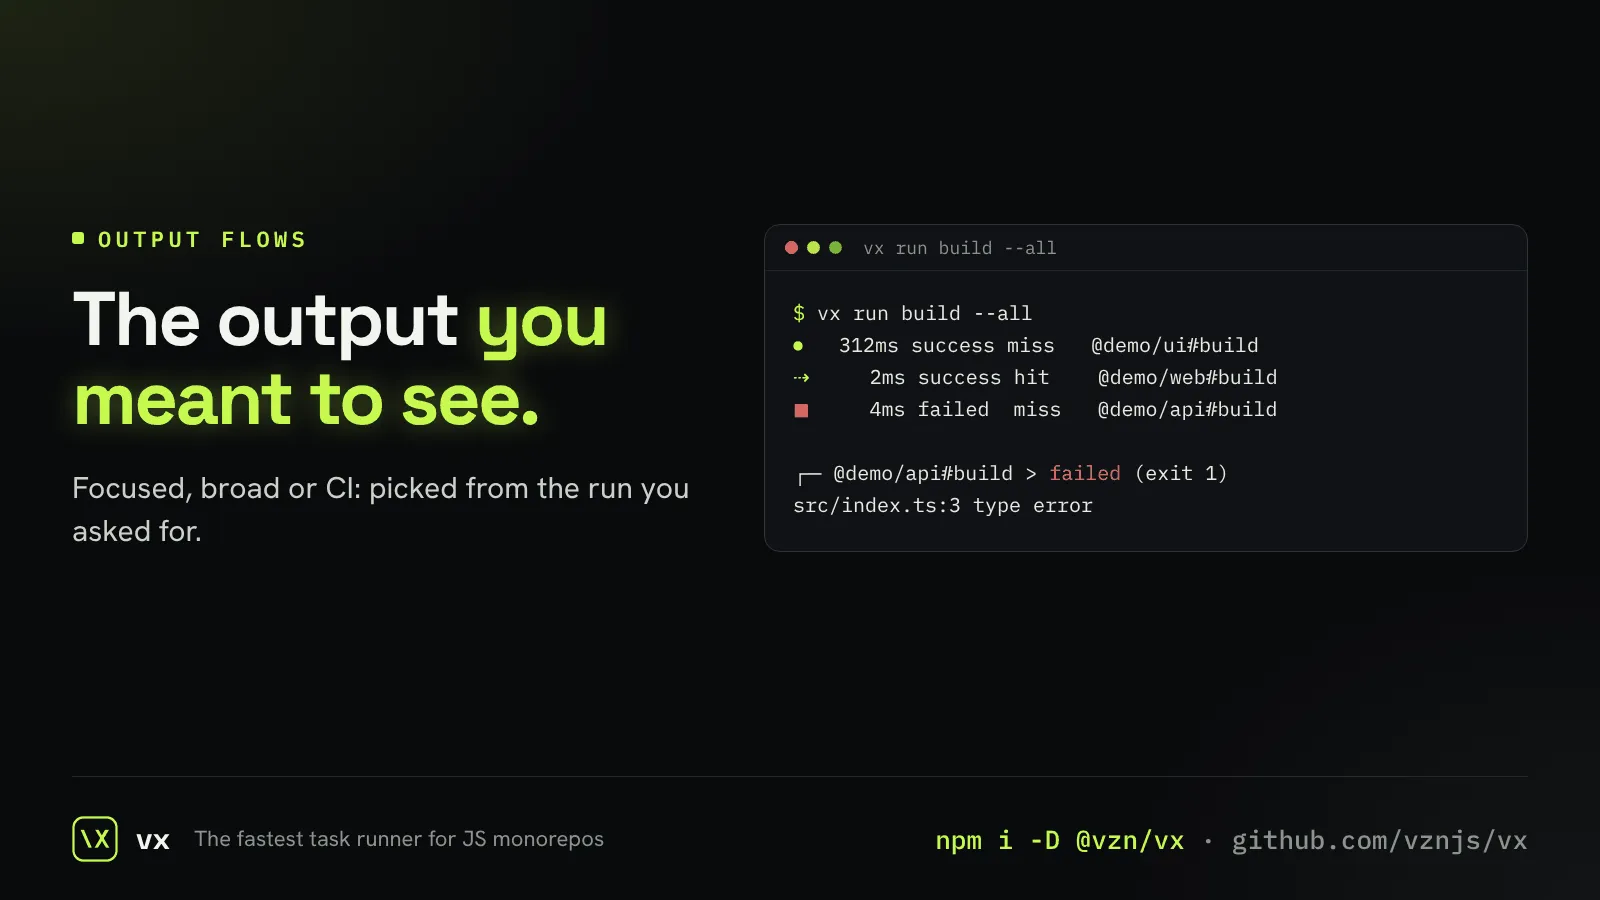
Output that follows the run
One task streams live; a broad run shows one line per task; CI shows everything.
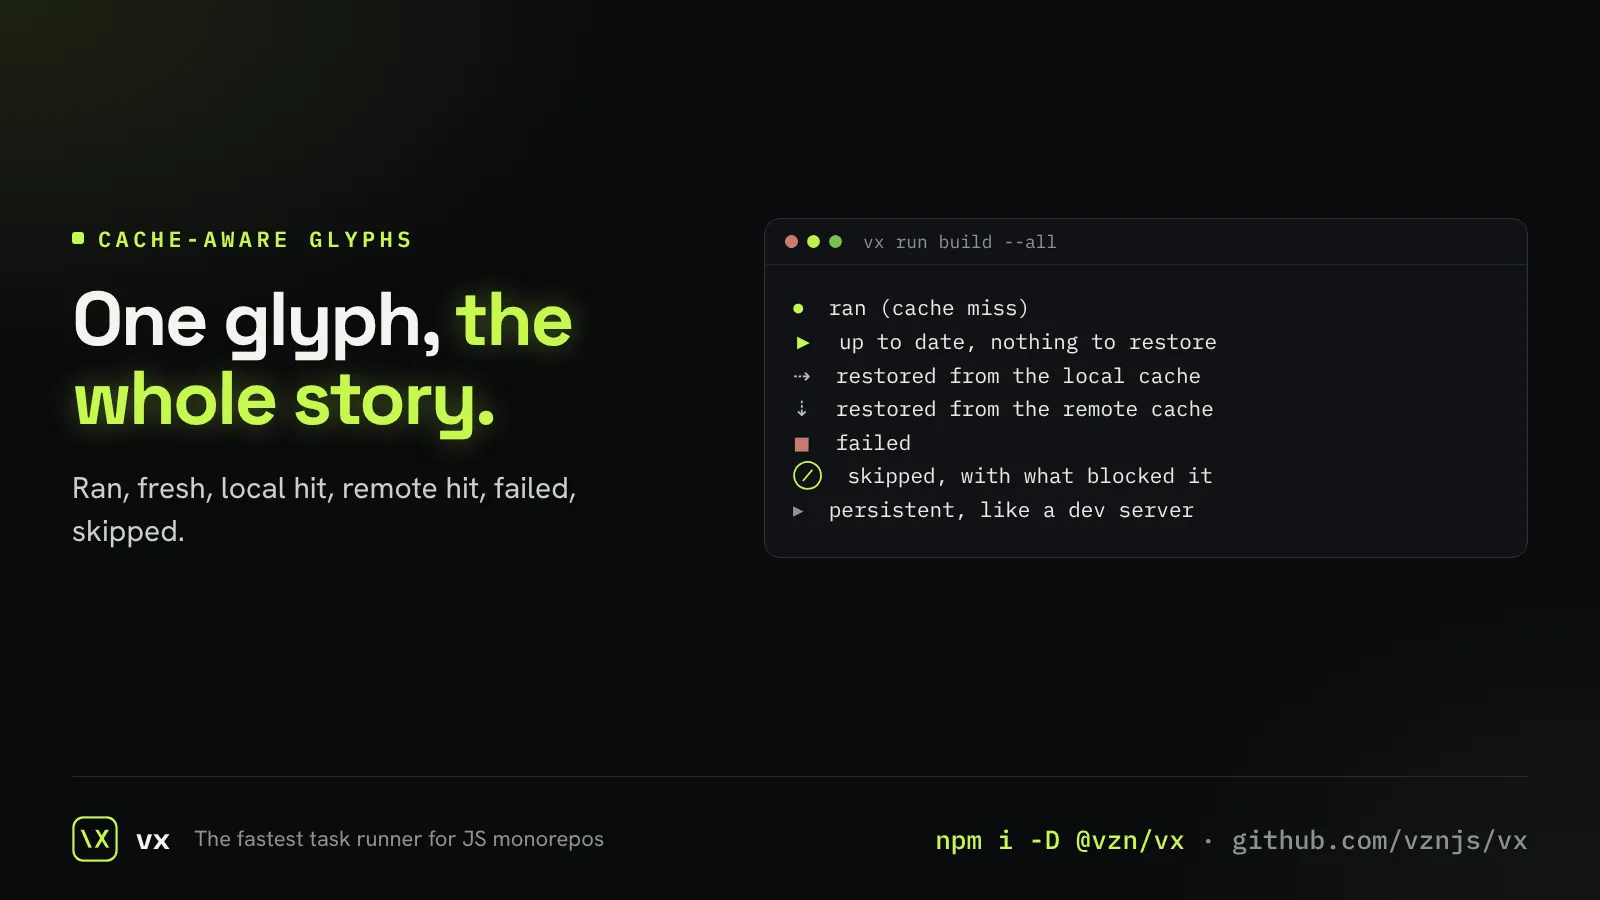
Glyphs that show the cache
Each task’s line shows at a glance whether it ran, was fresh, or came from a cache.
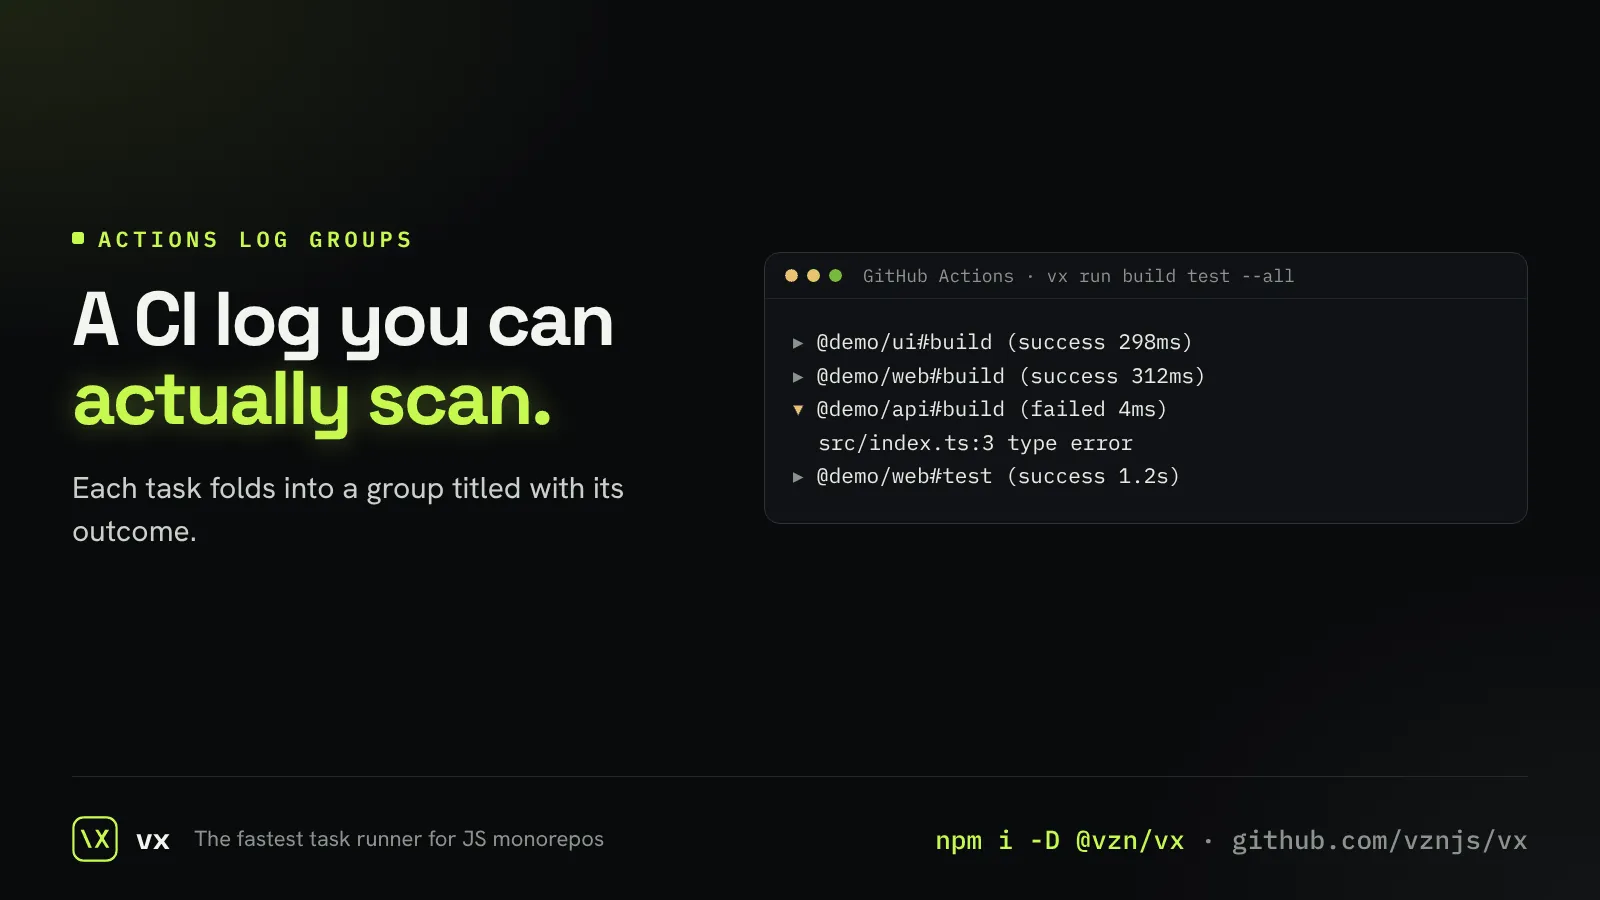
Folded logs on GitHub Actions
On Actions, each task is a collapsible group with its result in the title.
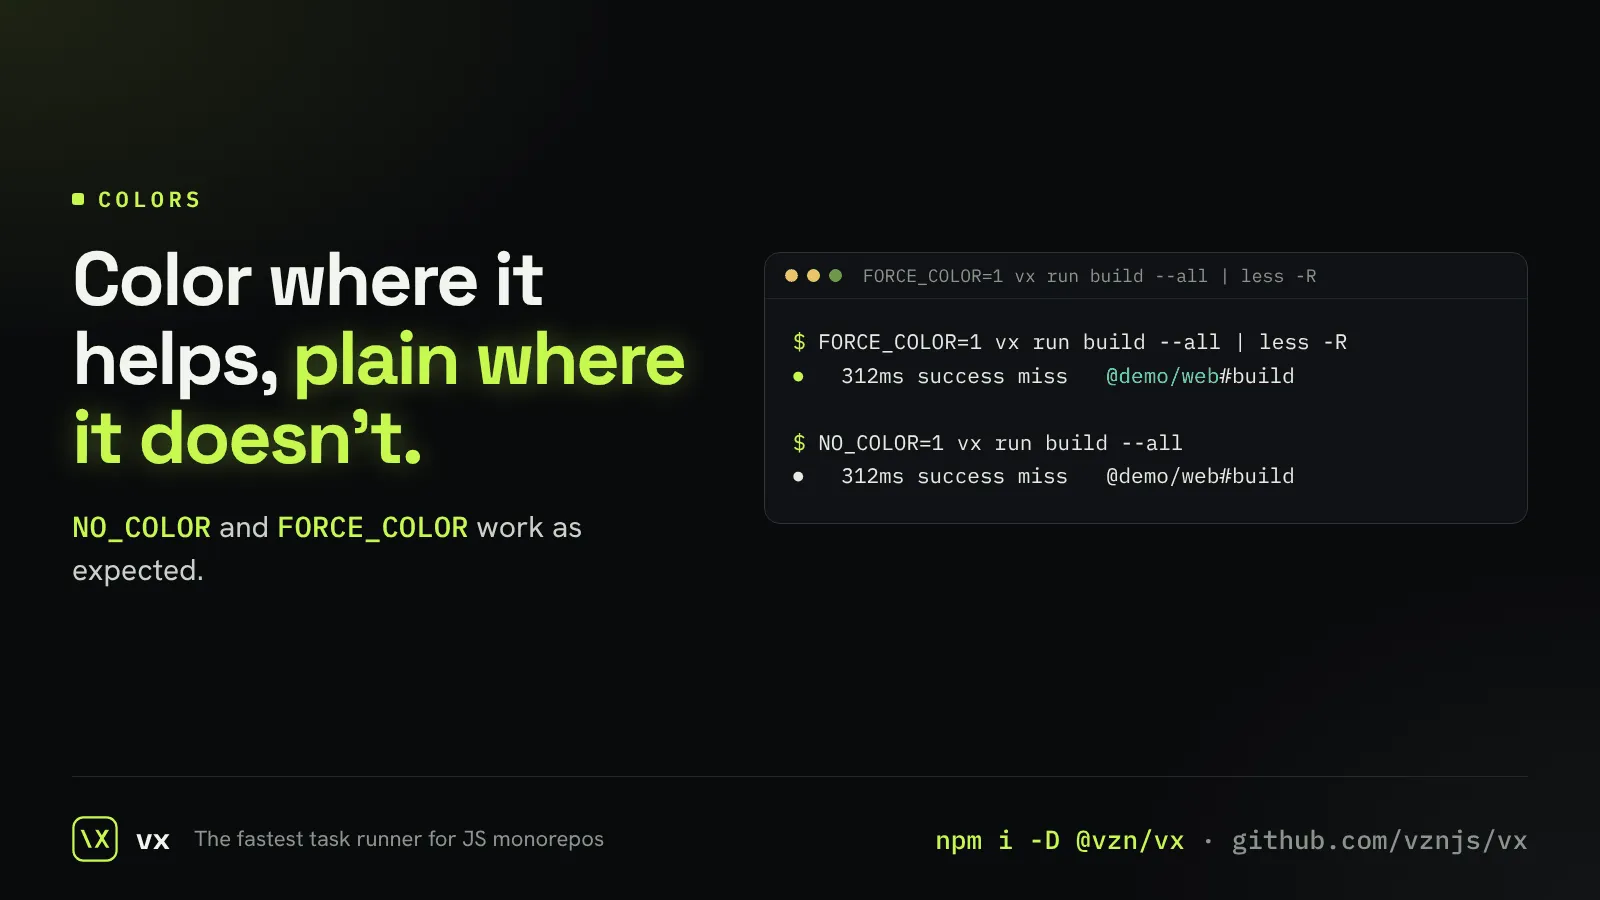
Colors, on your terms
Truecolor output, turned off with NO_COLOR or forced on with FORCE_COLOR.
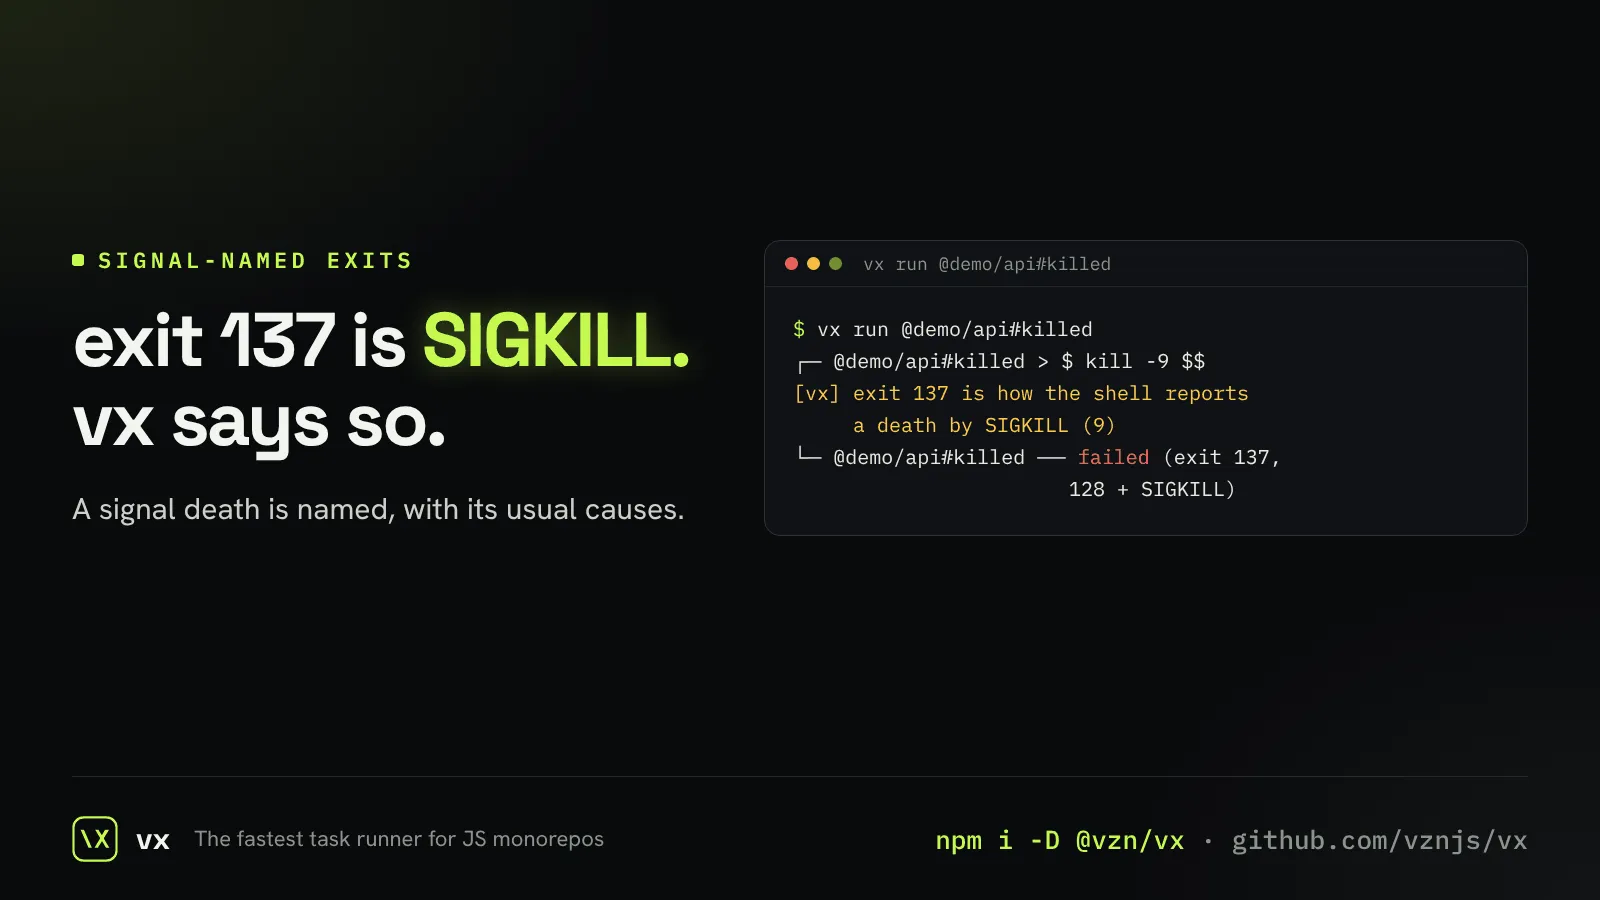
Exit codes in plain words
A task killed by a signal says which signal, not just a number.
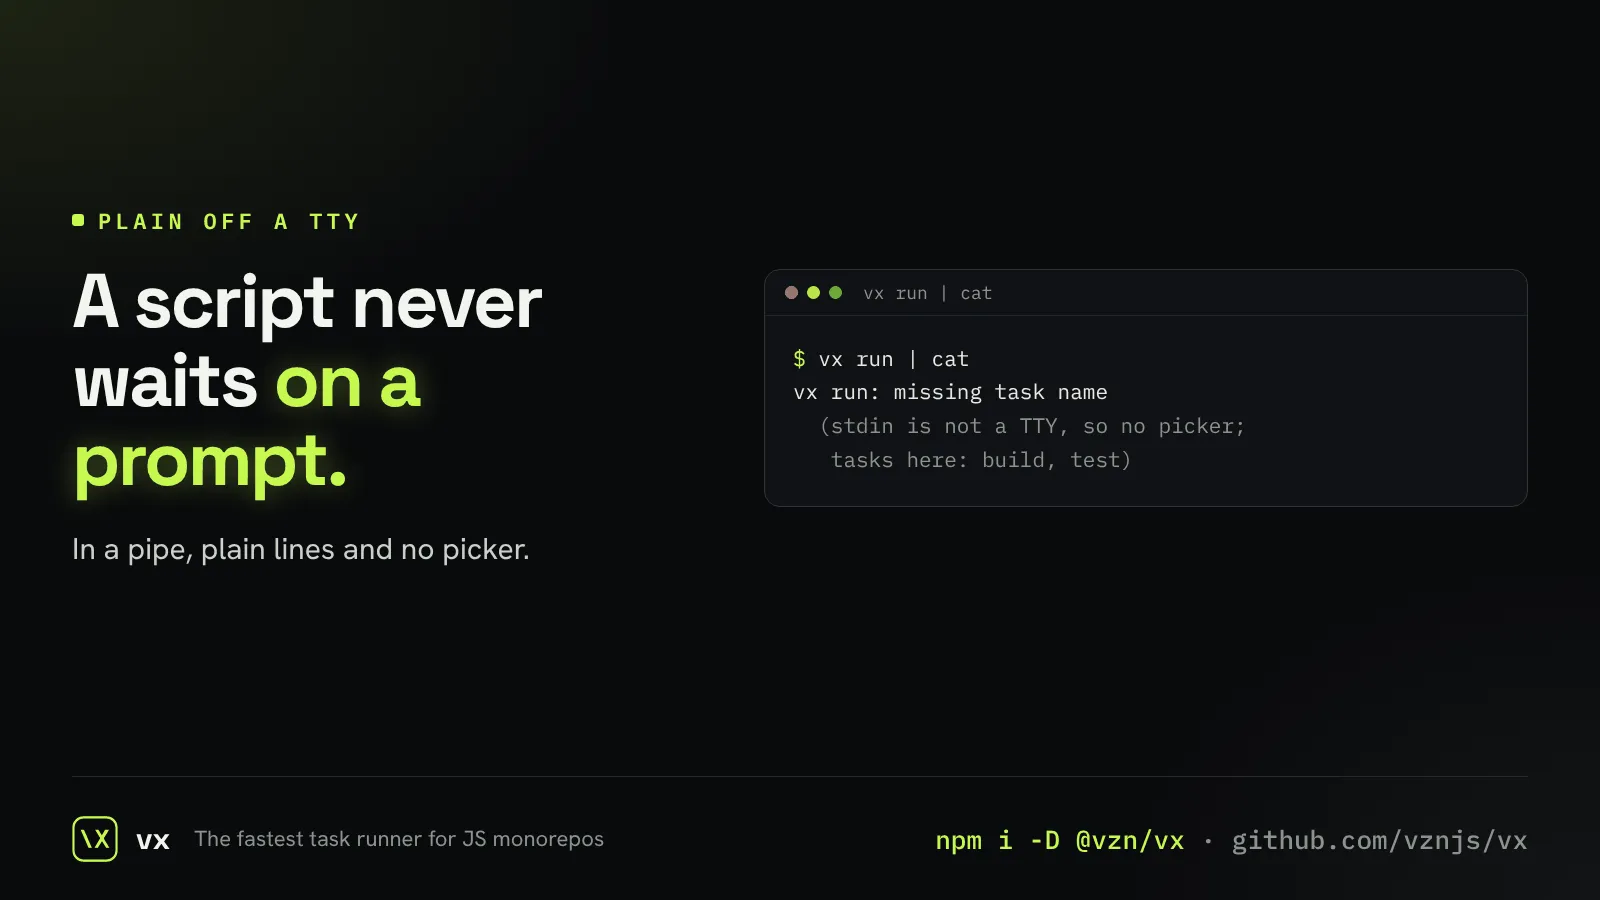
Plain output in a pipe
Off a terminal, vx prints plain lines and never waits on a prompt.