
Dashboard
The dashboard is the UI of @vzn/vx-cloud, the self-hosted CI
platform. It ships inside the compiled
vx-cloud binary and the Docker image — the same vx-cloud server
process that serves the analytics API serves the dashboard at /. There
is nothing to build and no asset directory on disk: the SPA is embedded in
the executable.
Open your deployment’s VX_CLOUD_BASE_URL in a browser and the dashboard
loads. It is served by vx-cloud server — core vx has no server
commands.
A quick tour
Section titled “A quick tour”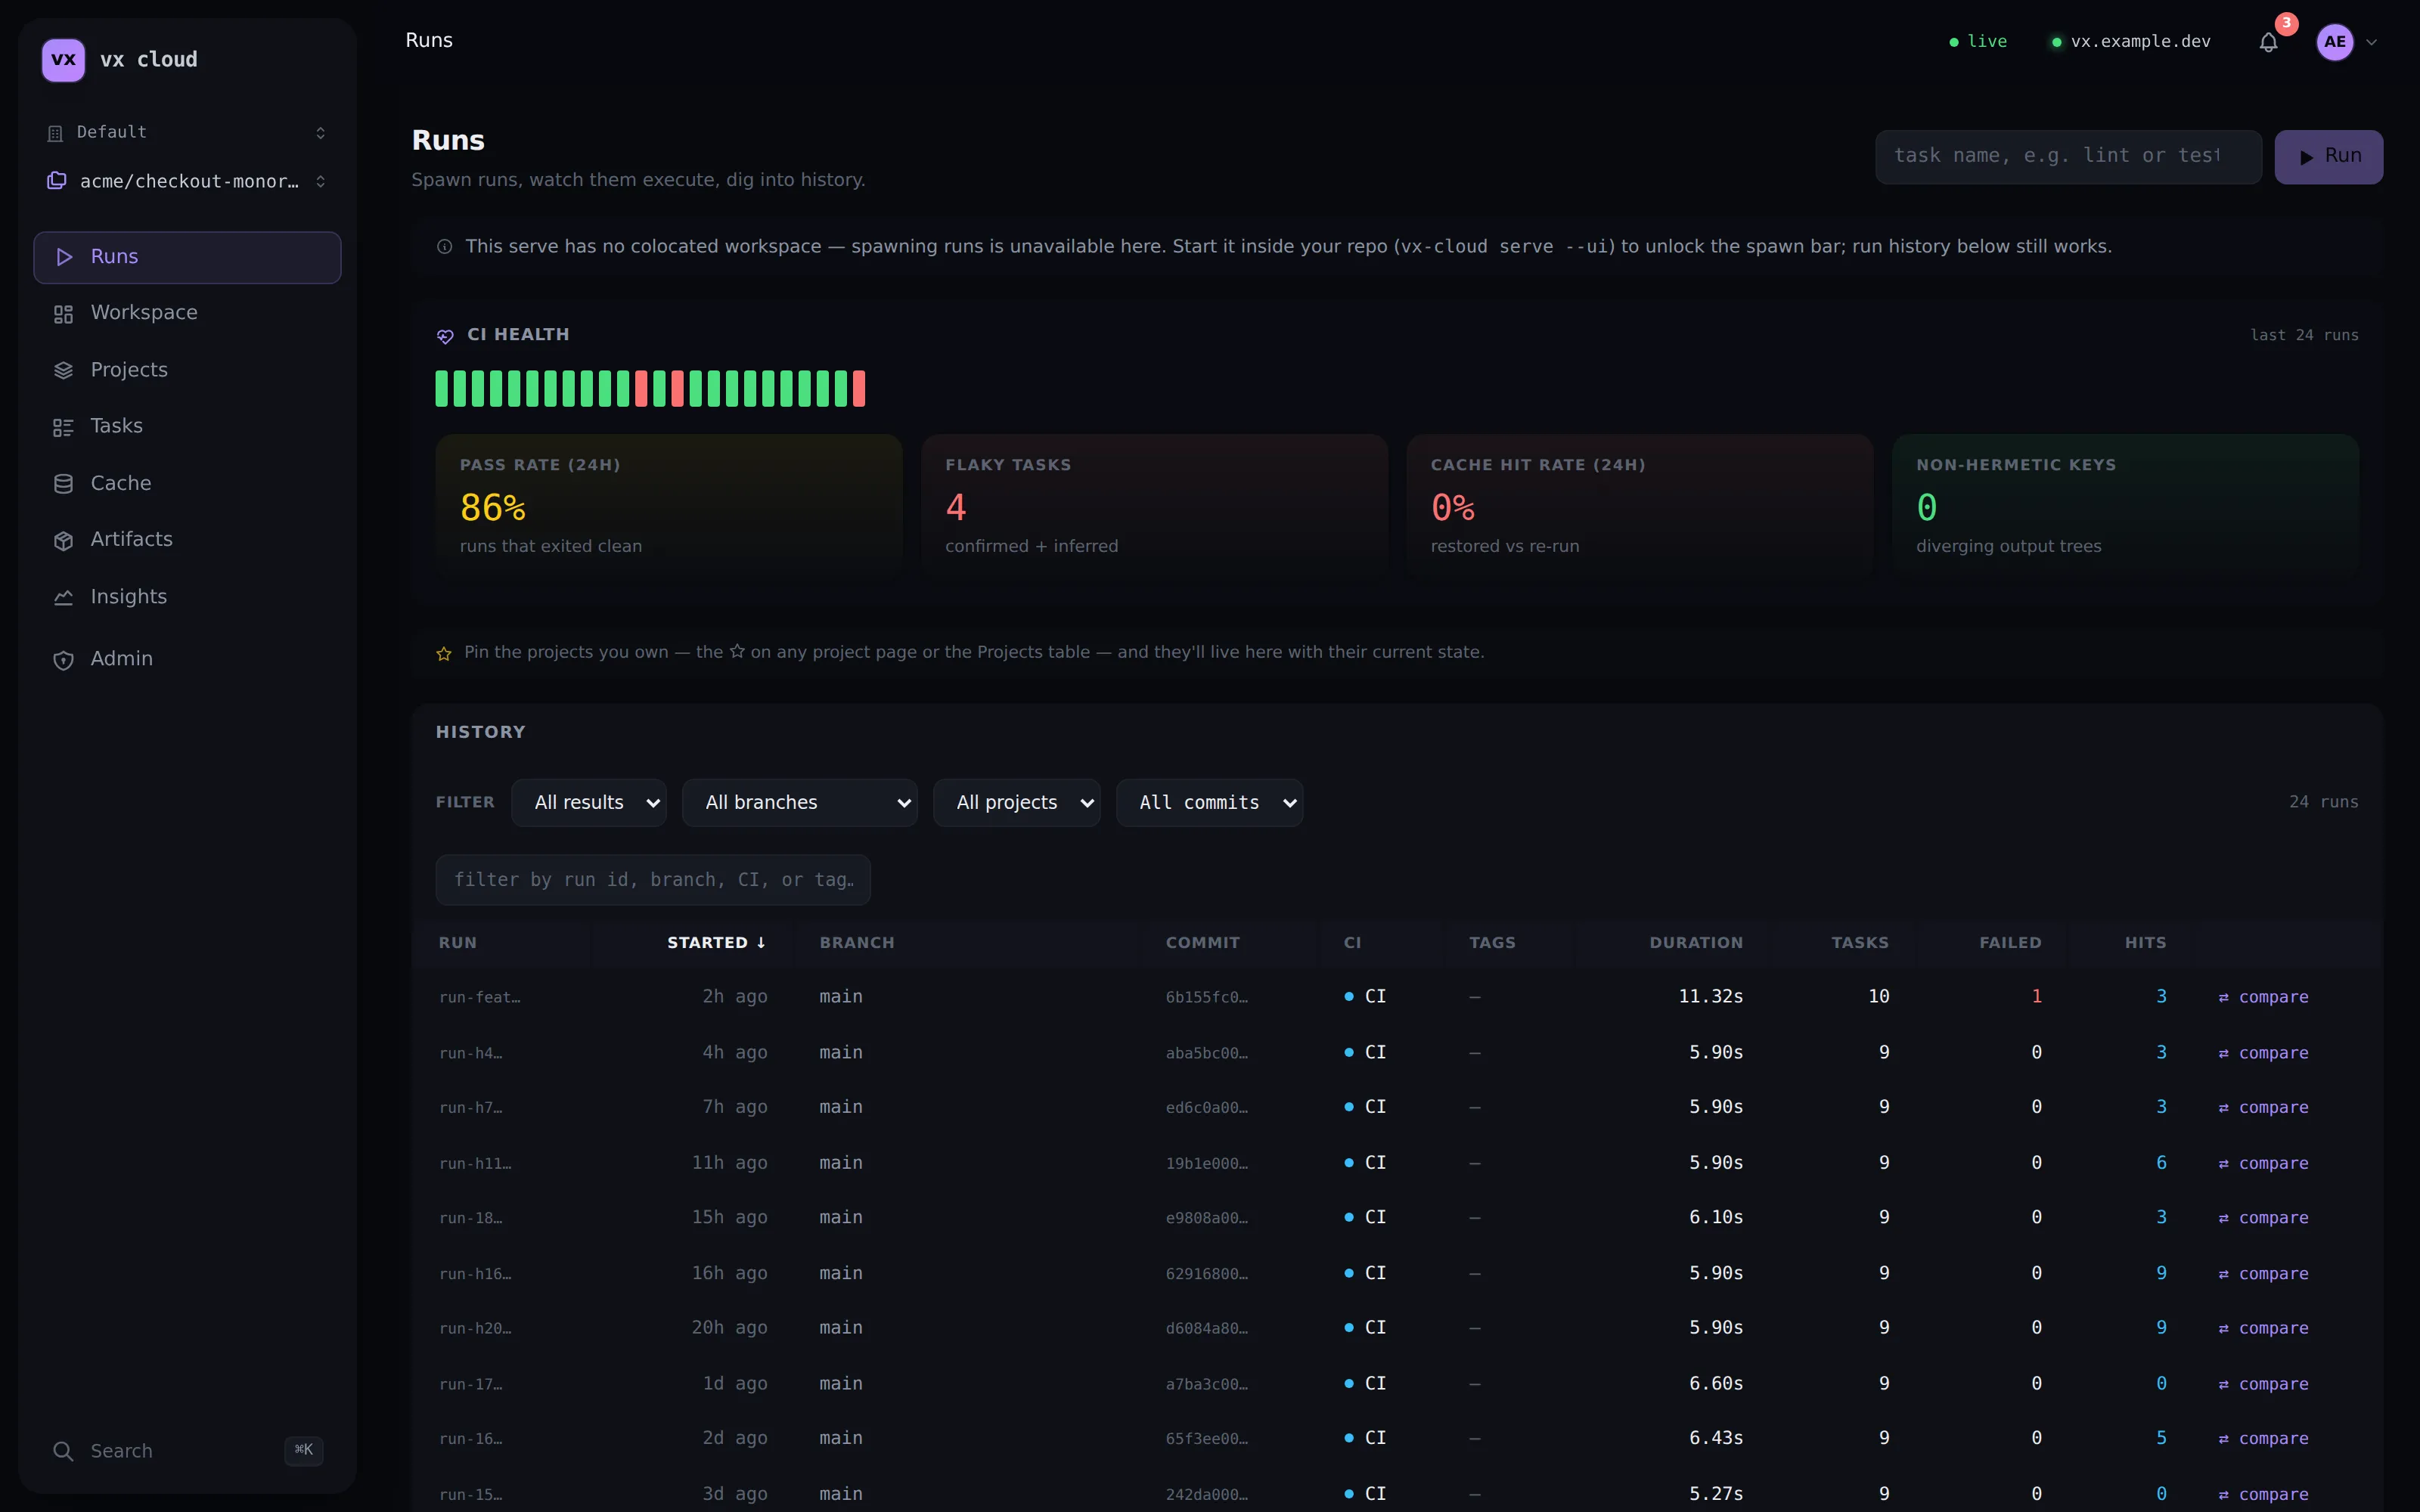
The Runs landing is the dev’s entry point: a live CI-health strip
(pass rate, flaky count, cache hit rate) over a filterable history of
every vx run, faceted by result, branch, project, and commit.
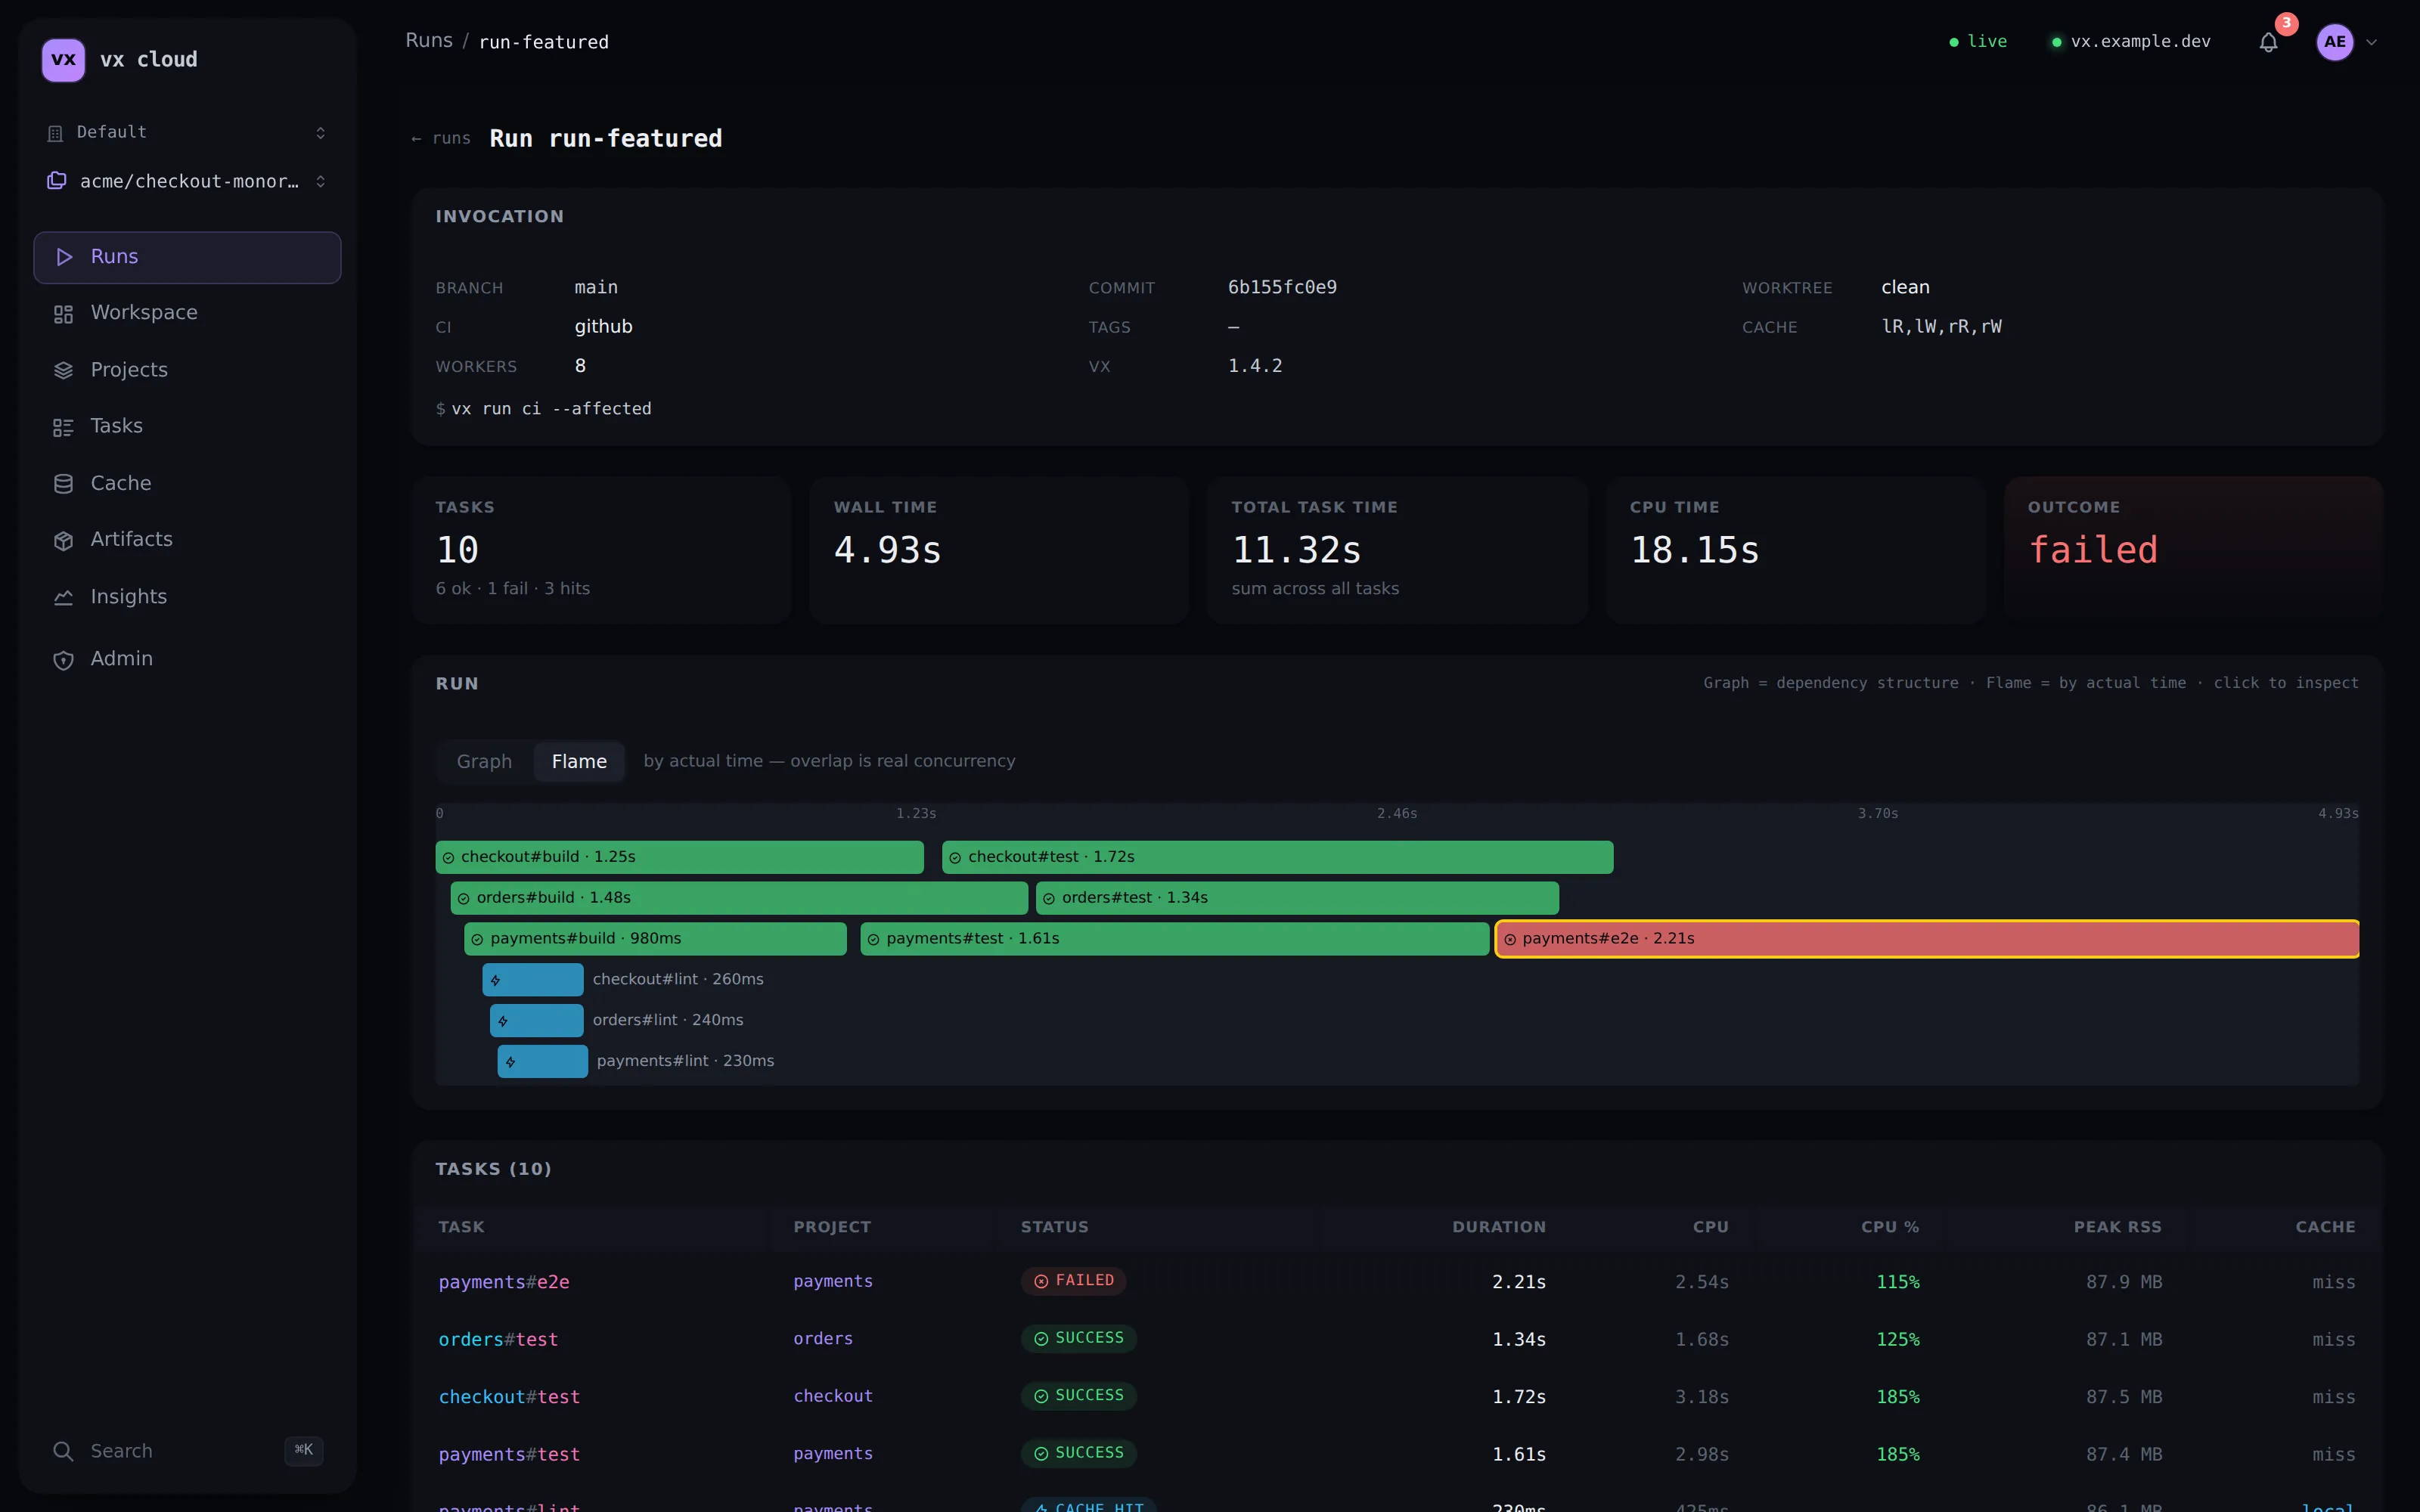
Open any run to see its flamegraph — each task a bar on the real timeline, so overlap is genuine concurrency and the critical path is obvious. The invocation header carries the branch, commit, worker count, and cache policy; per-task rows add CPU time and peak RSS. One click from here reaches a task’s logs and artifacts.
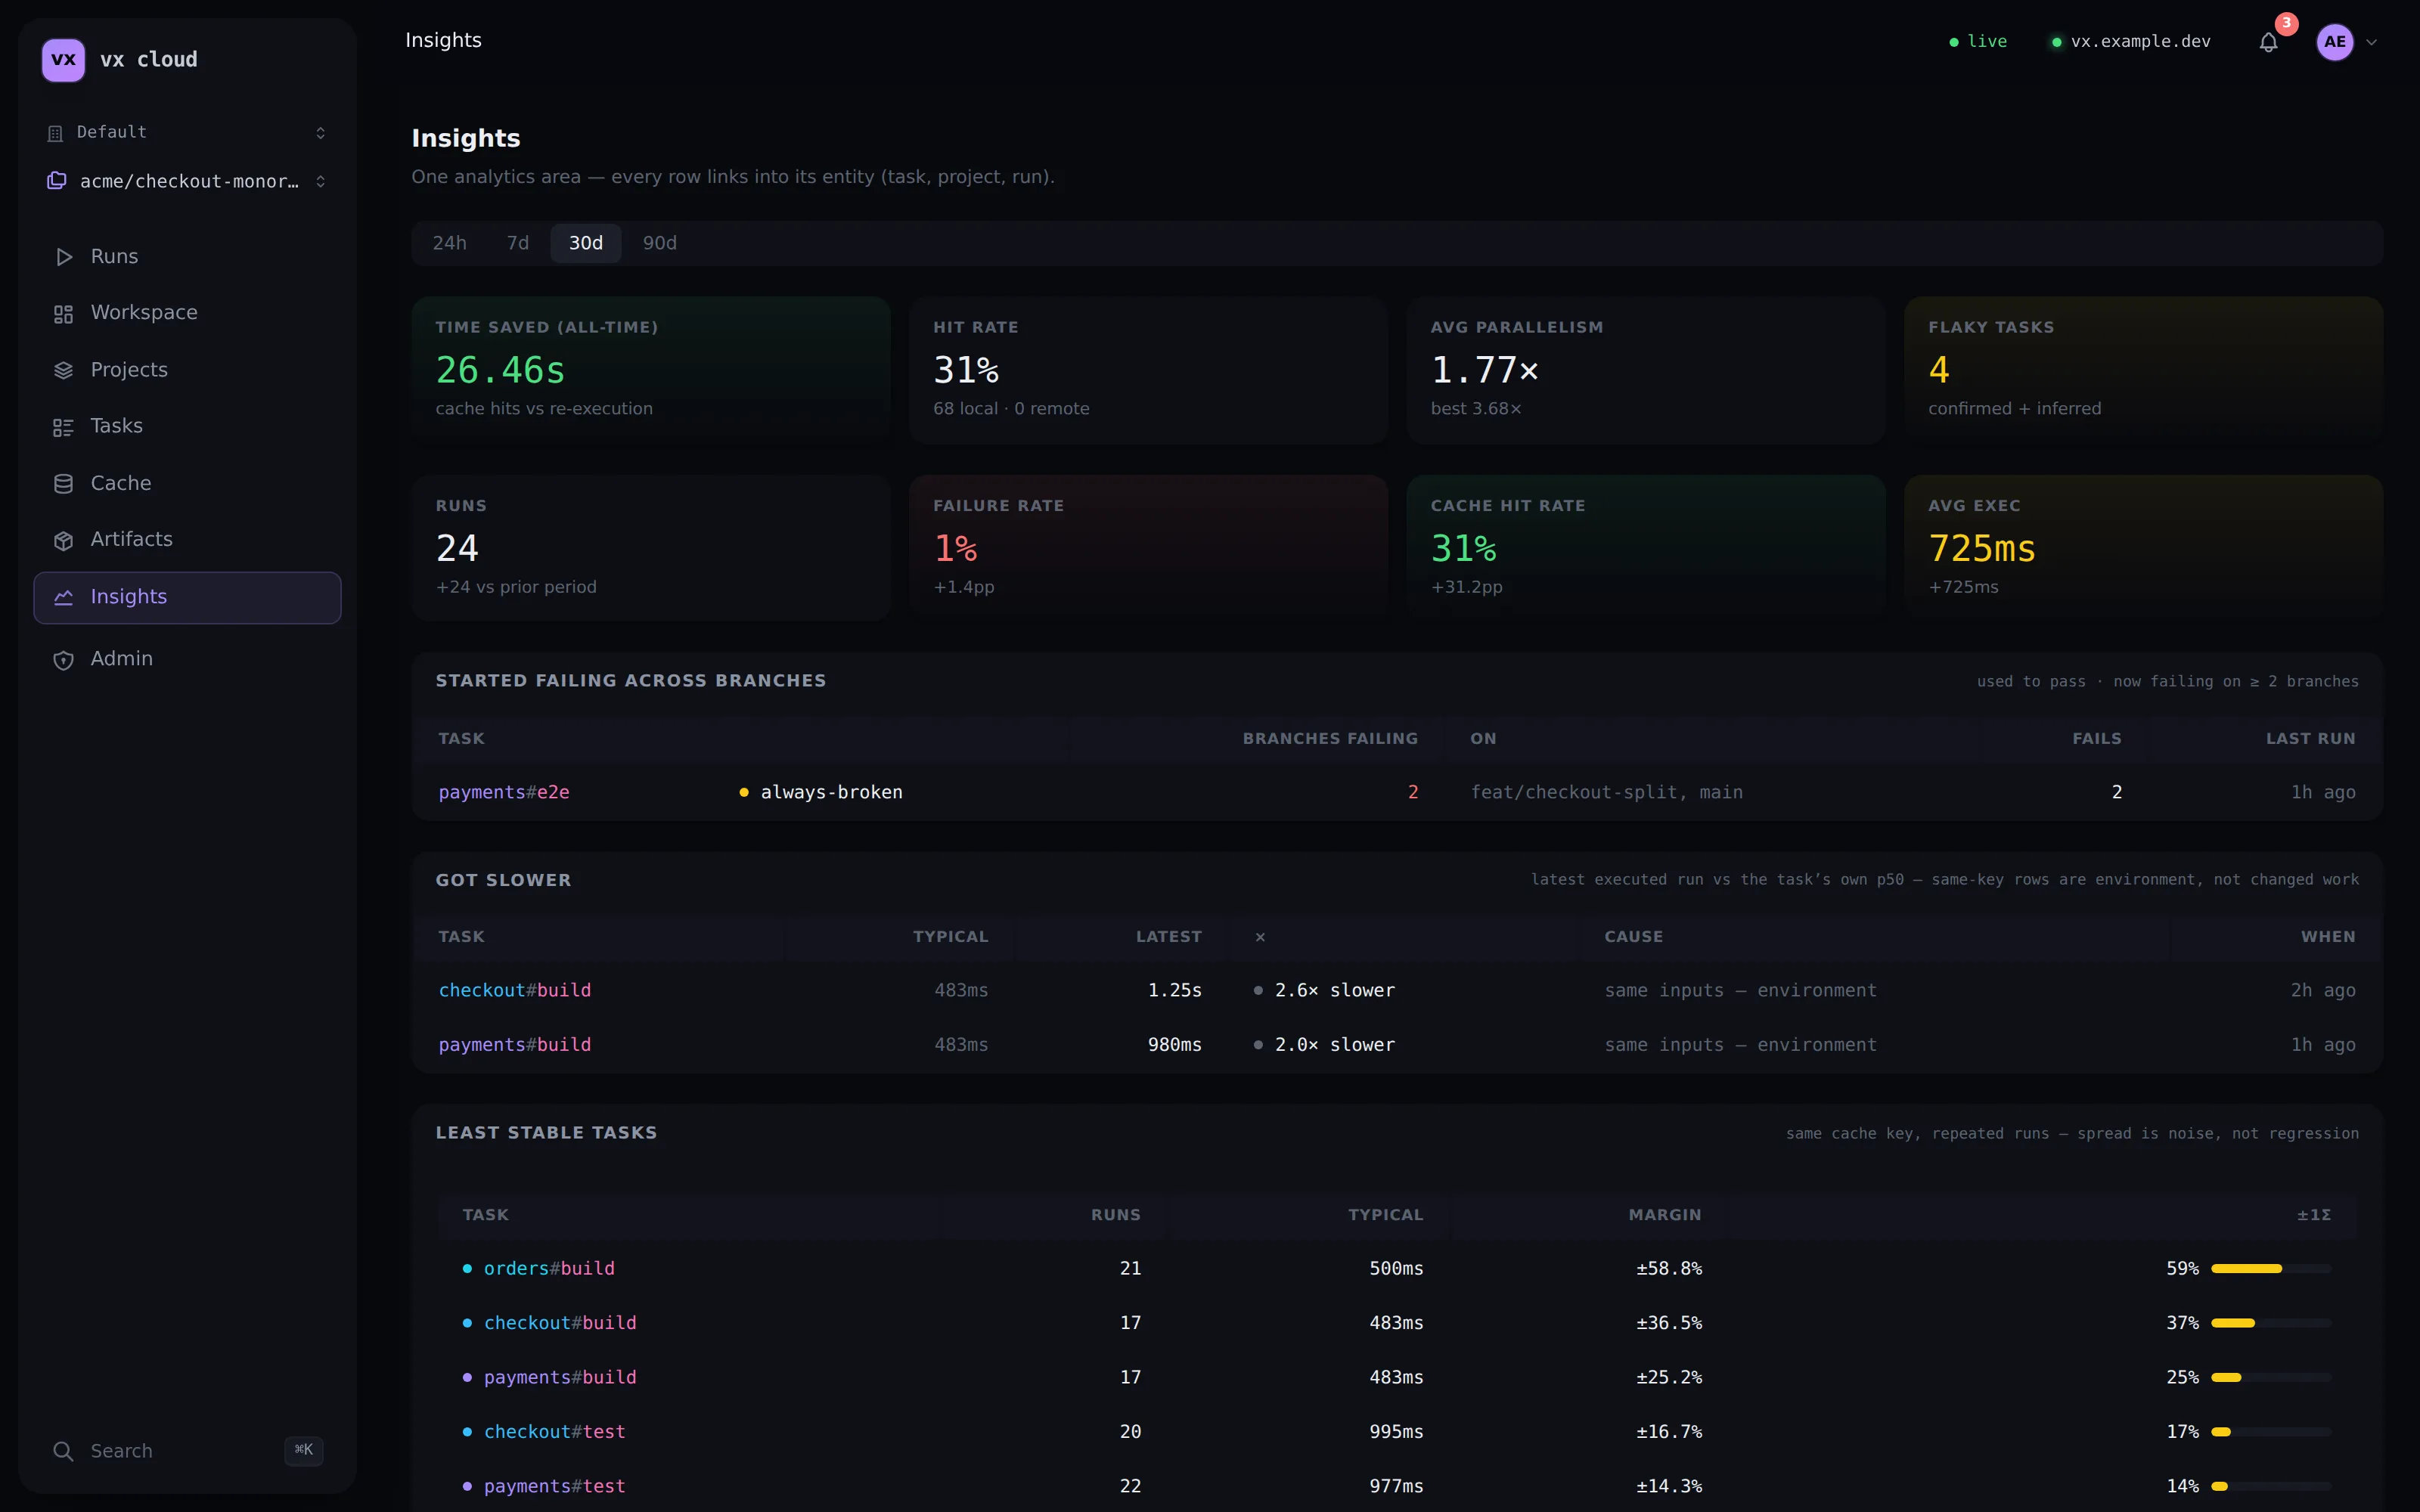
The Insights area turns history into answers: it names the task that
started failing across branches (here @acme/web#build, broken on two
open PRs) and ranks the biggest movers — tasks whose average duration
shifted most, with the signed delta and direction.
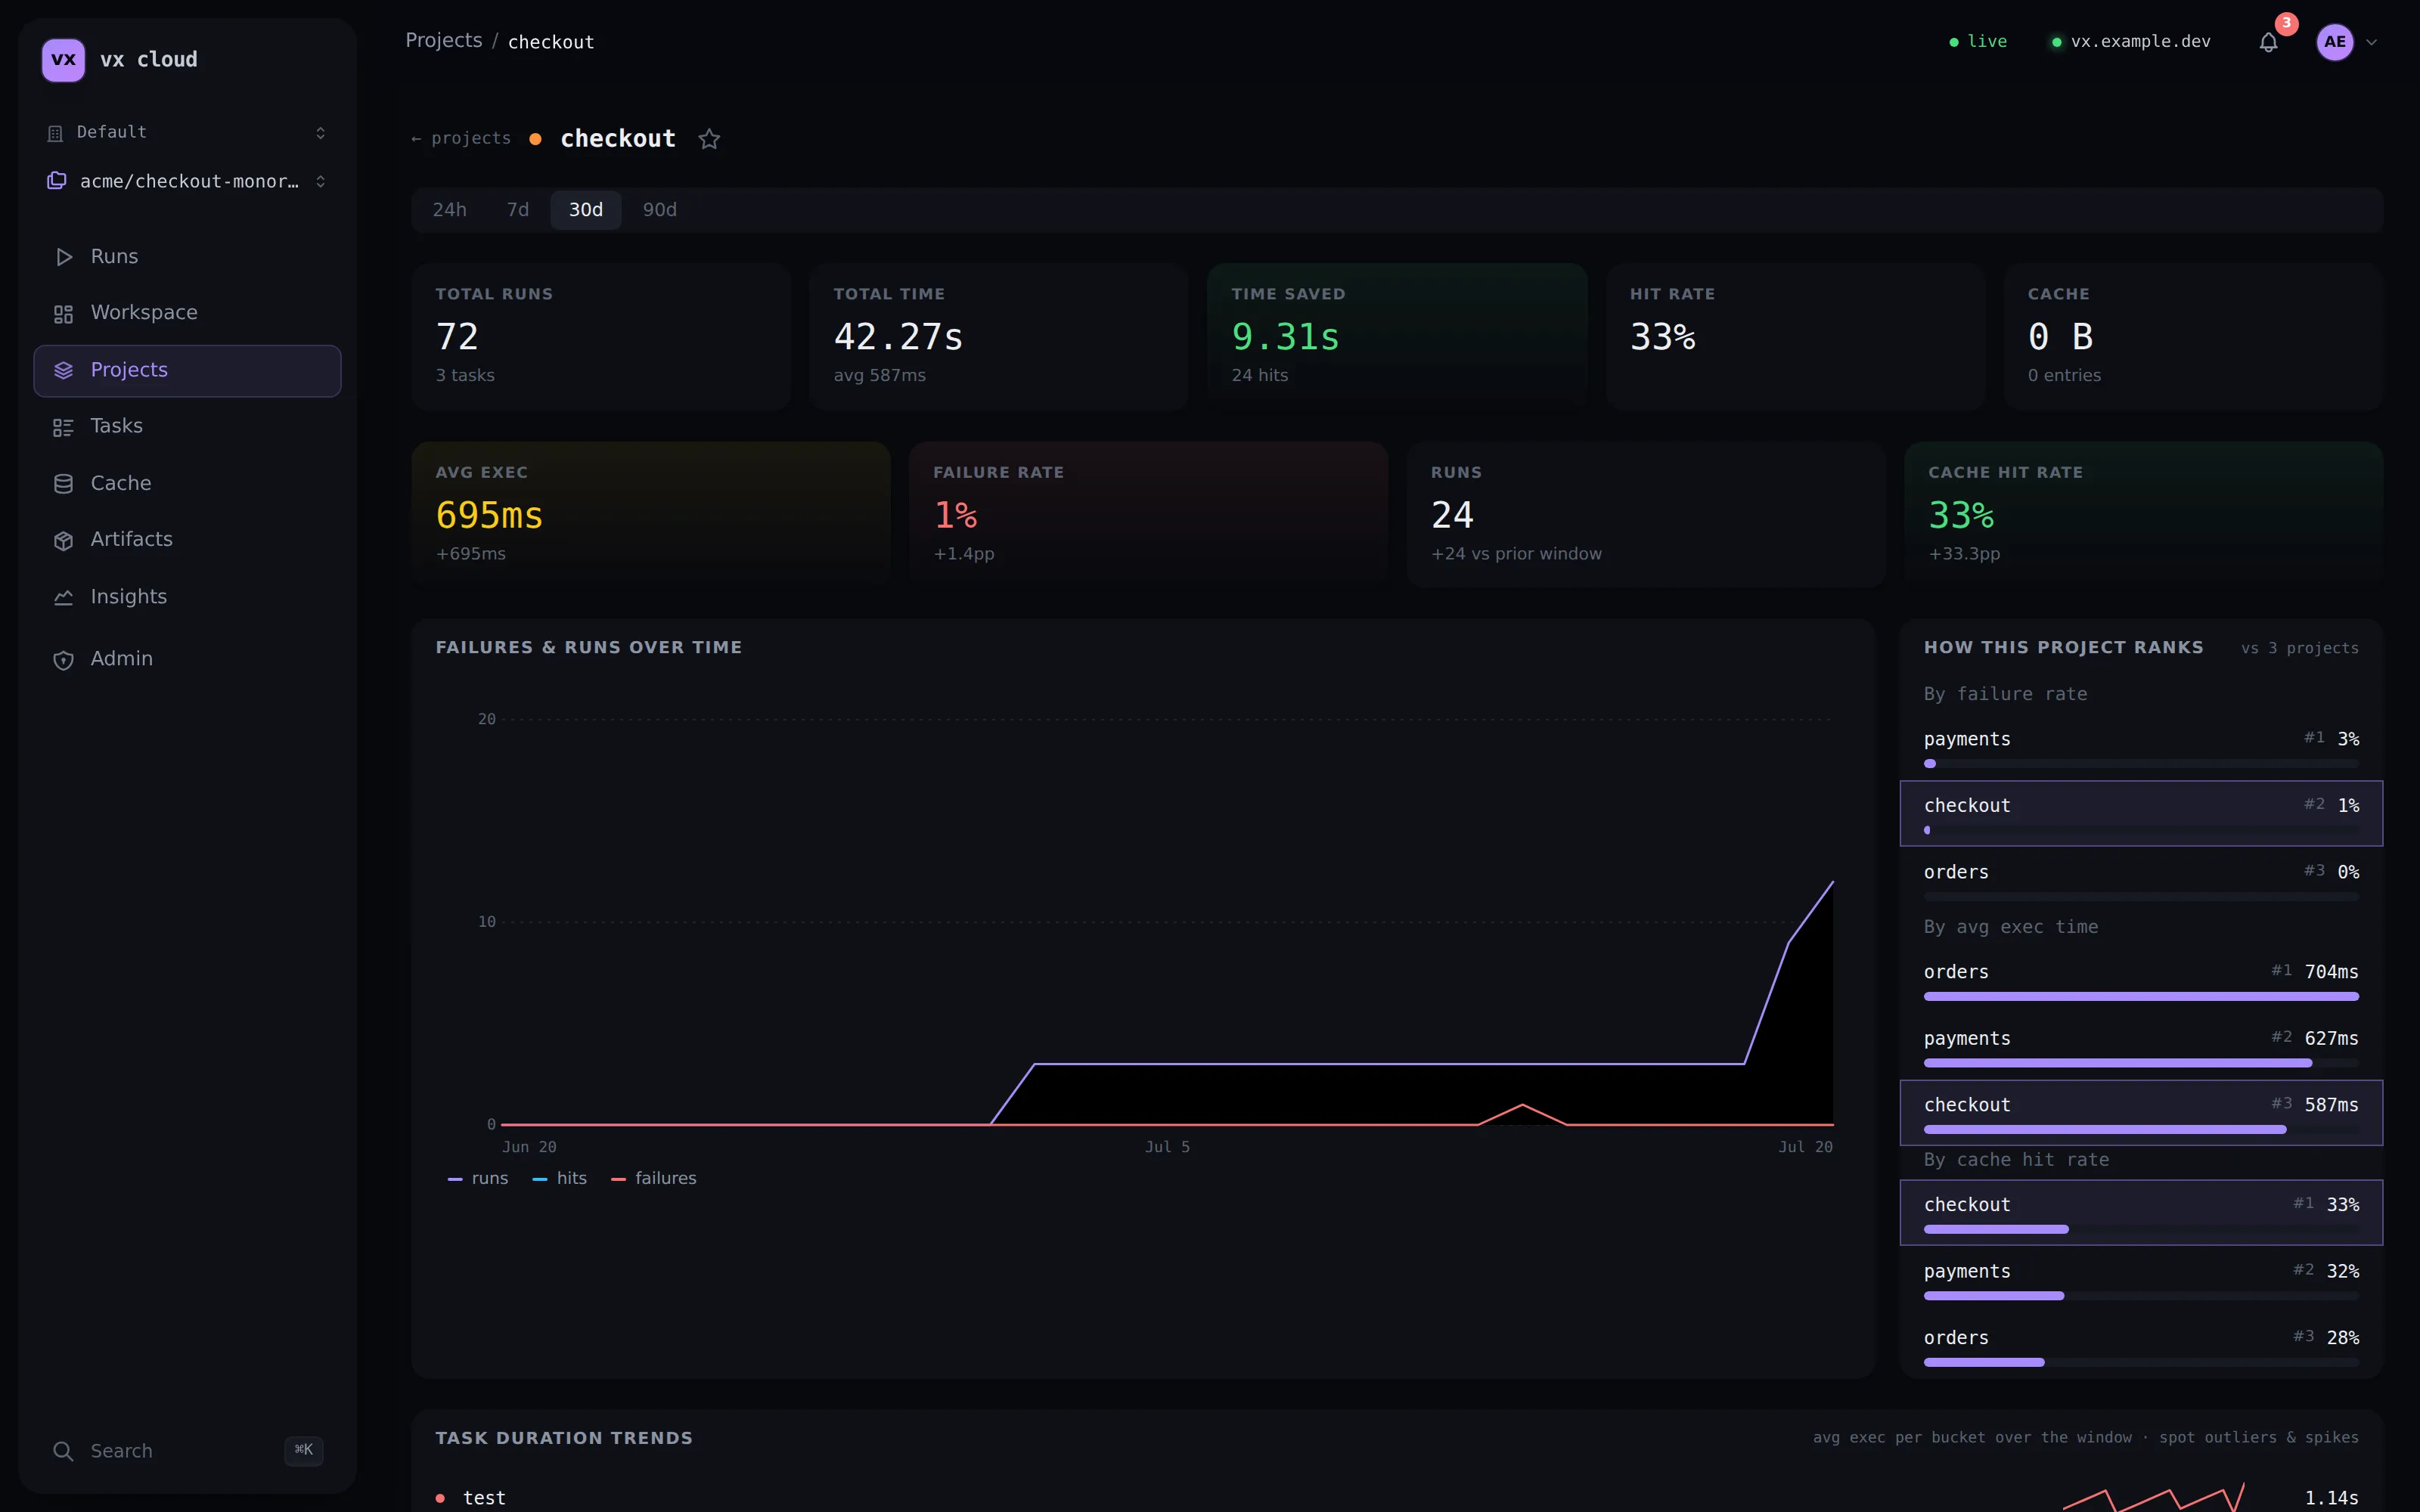
Every project has its own drill-in: a failures-and-runs trend, how it ranks against the other projects on failure rate and speed, per-task duration sparklines, and where each failure was first noticed across branches — the answer to “did my project get faster or slower?”
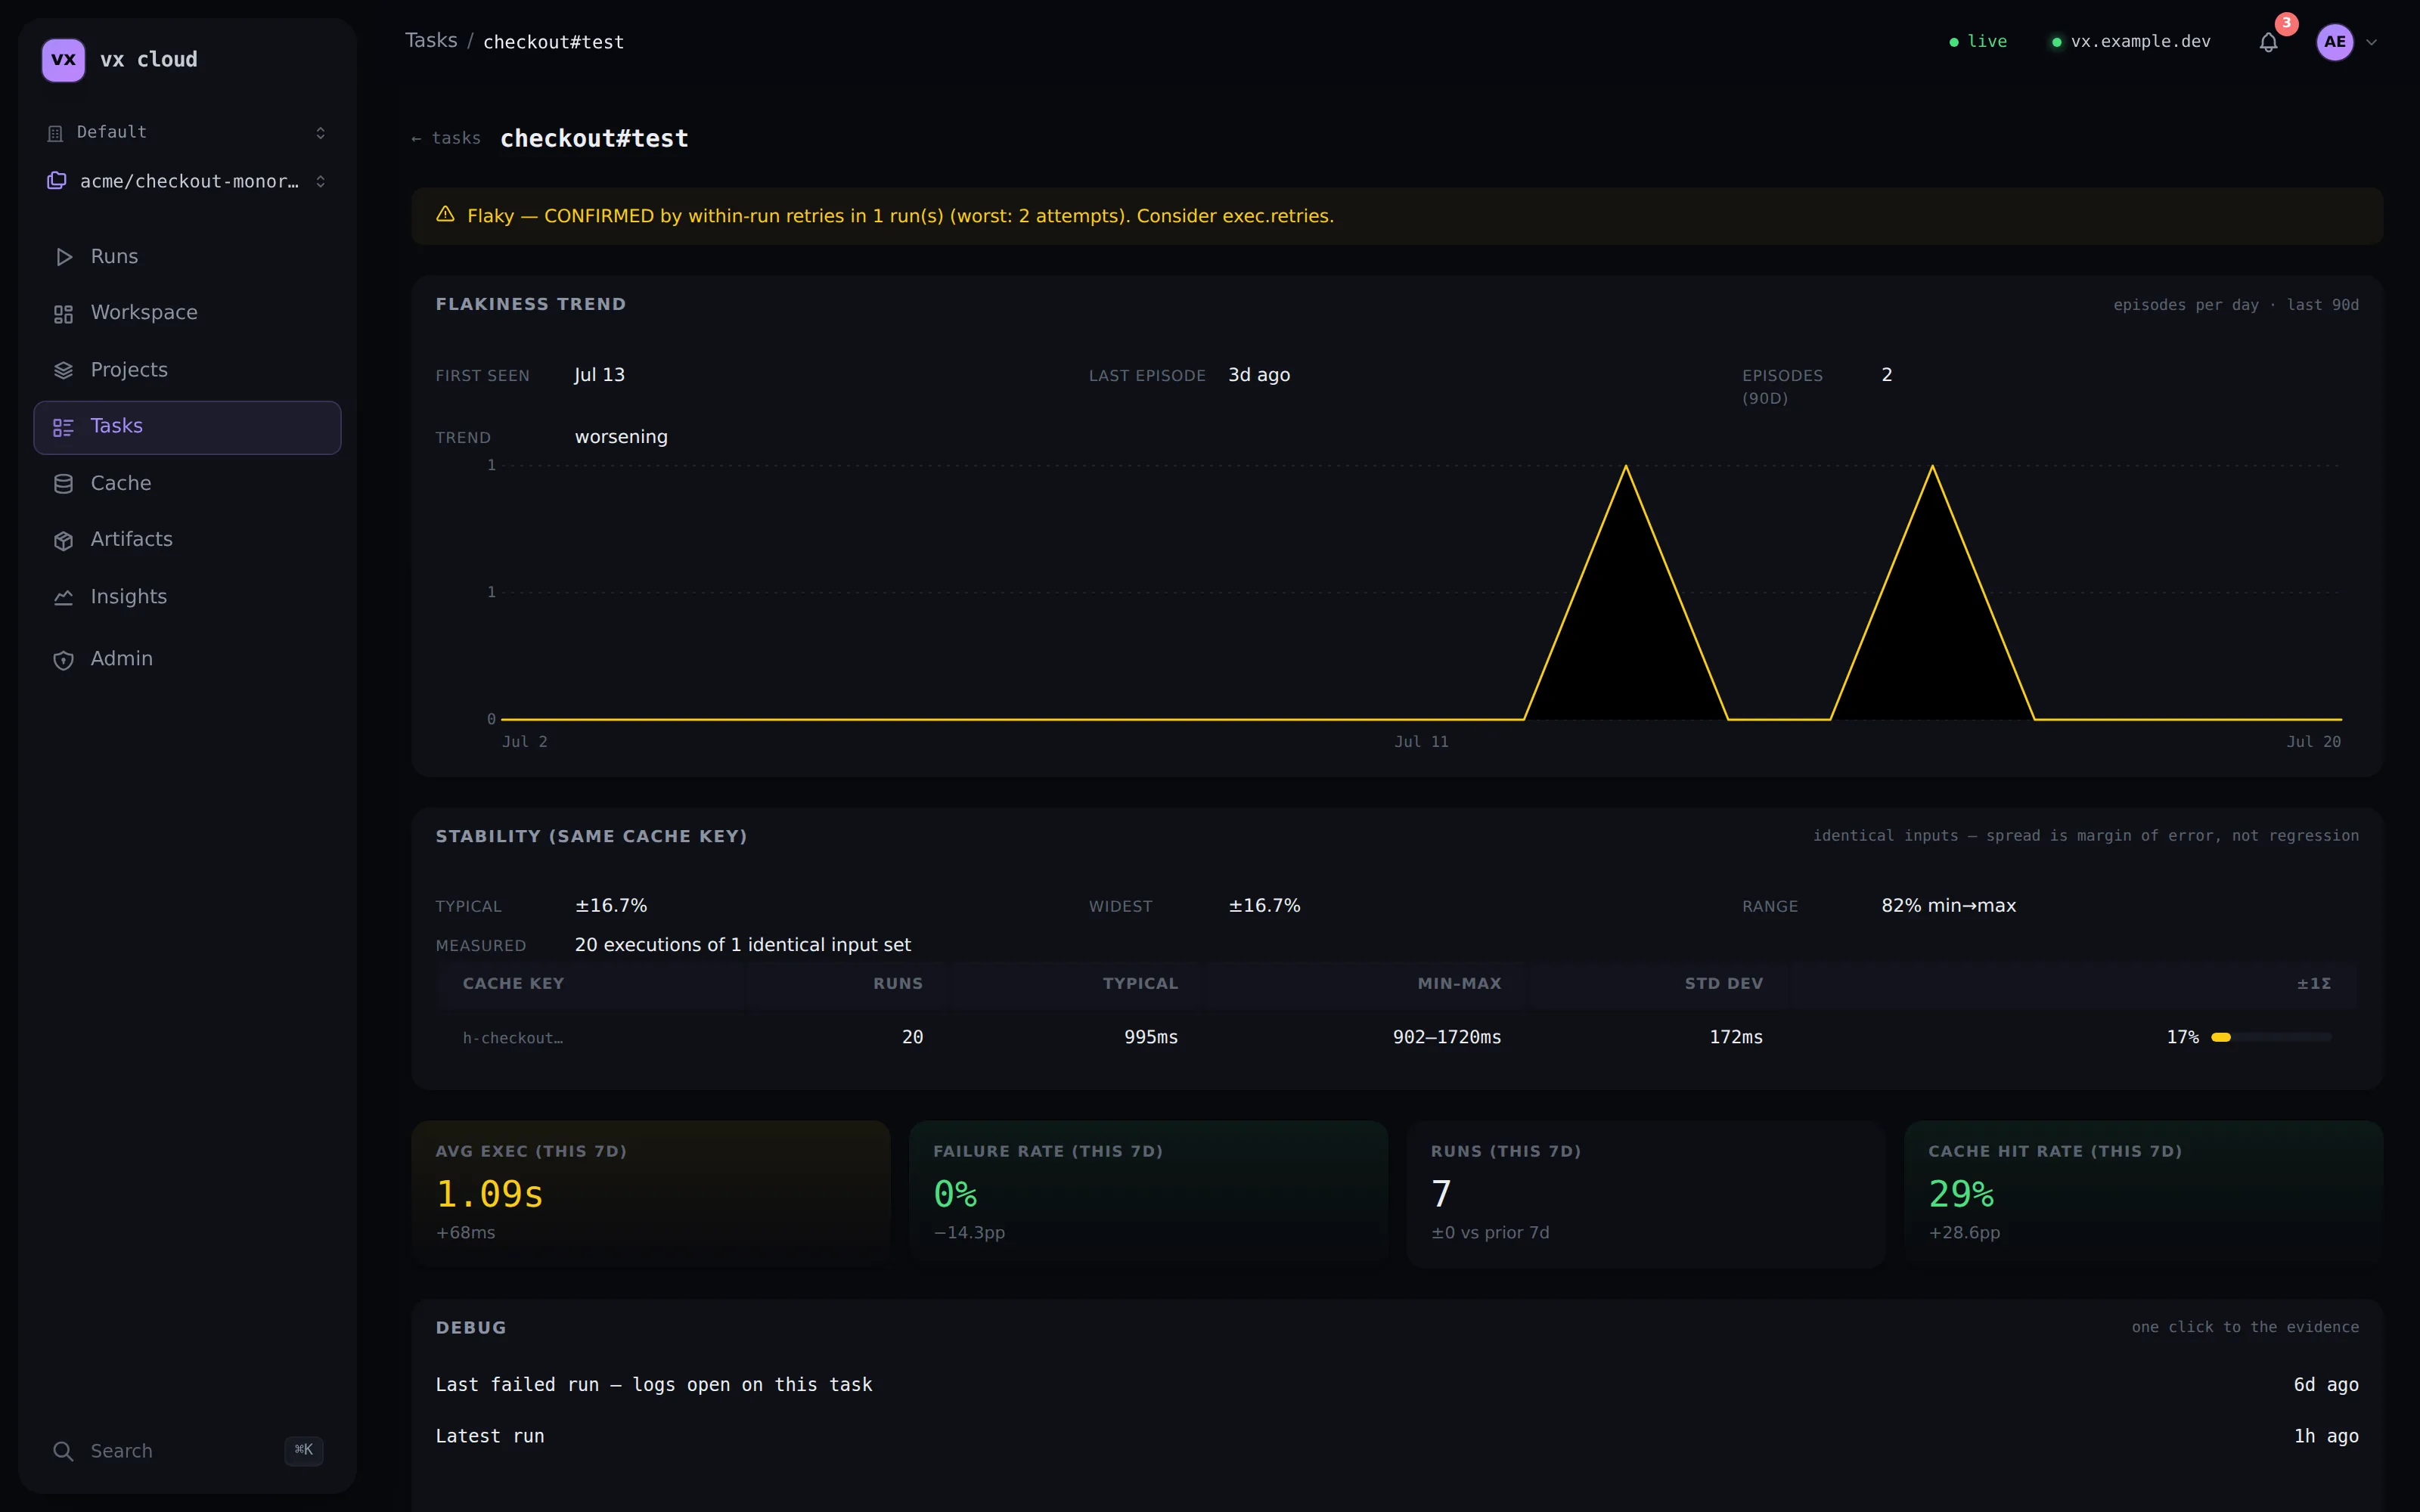
Drill into a single (project, task): a flaky badge, this-window-vs-prior
trend tiles, a Debug card (one click to the last failed run with its
logs), a Recommendations card that turns flaky/hermeticity/caching signals
into copy-pasteable config fixes, and a duration-over-recent-runs sparkline.
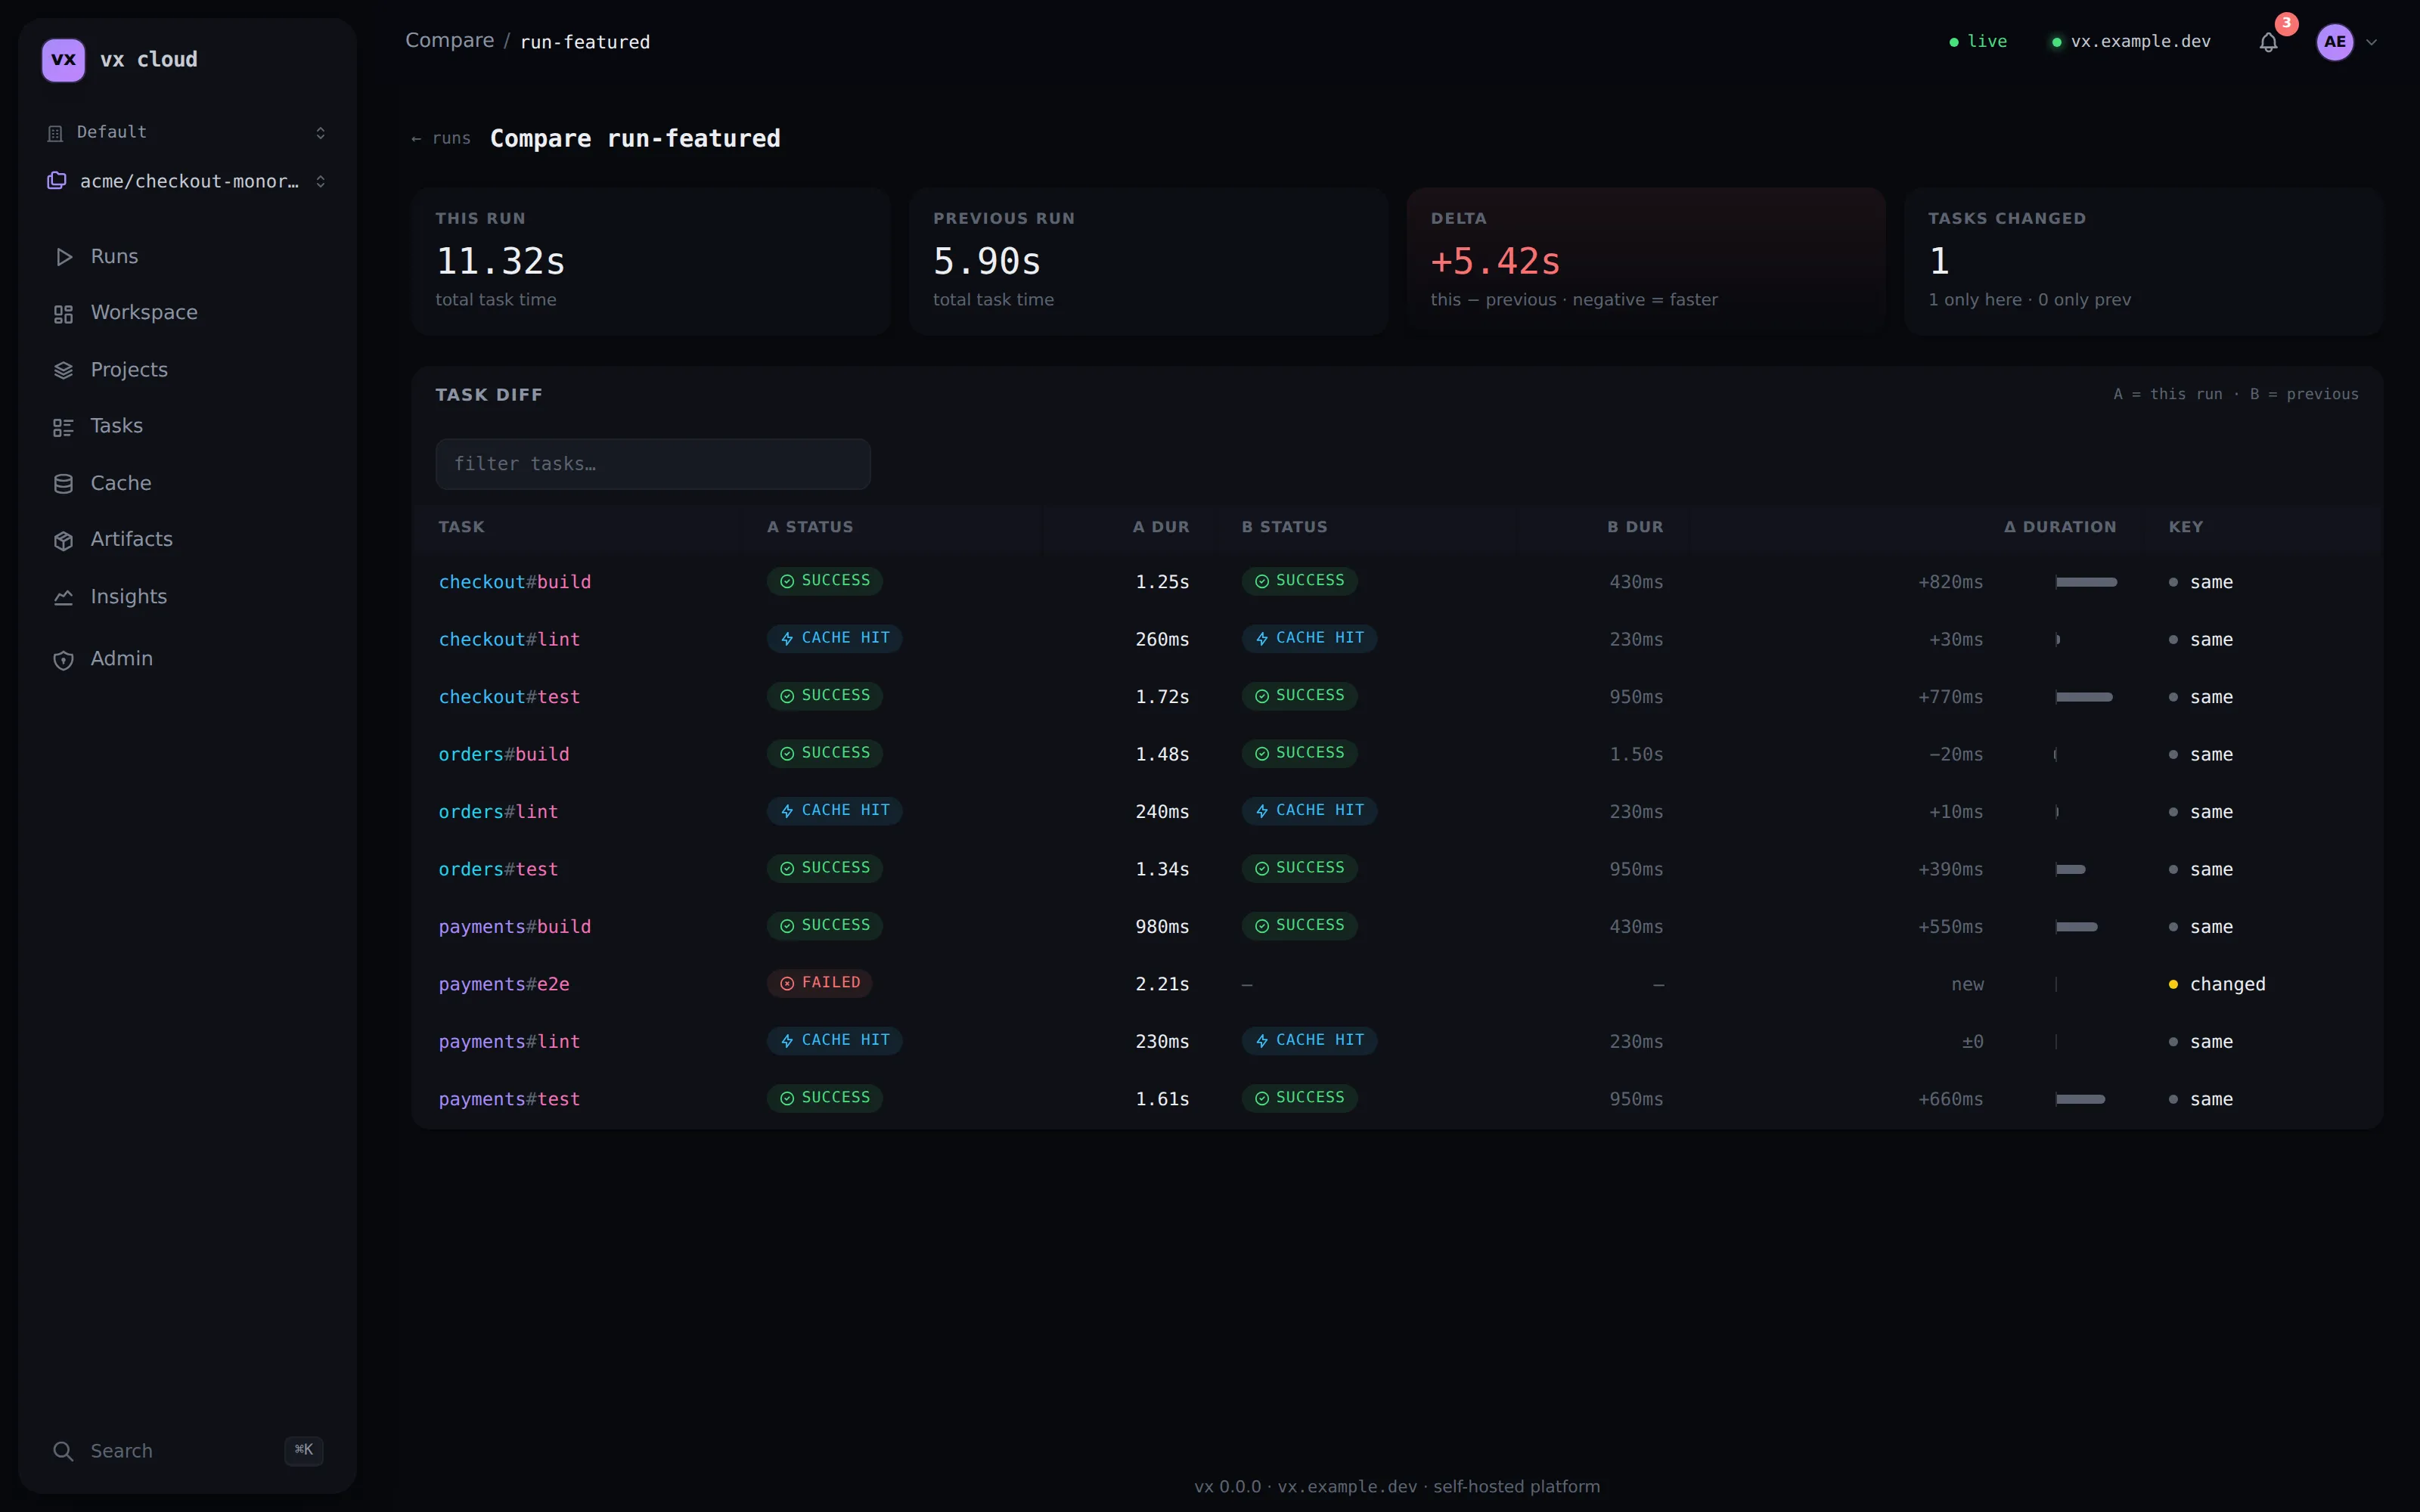
Compare any run against its immediately previous invocation: total-time delta, tasks-changed count, and a per-task diff — which tasks flipped to a cache hit, which got slower, which changed status — so a regression is one glance away.
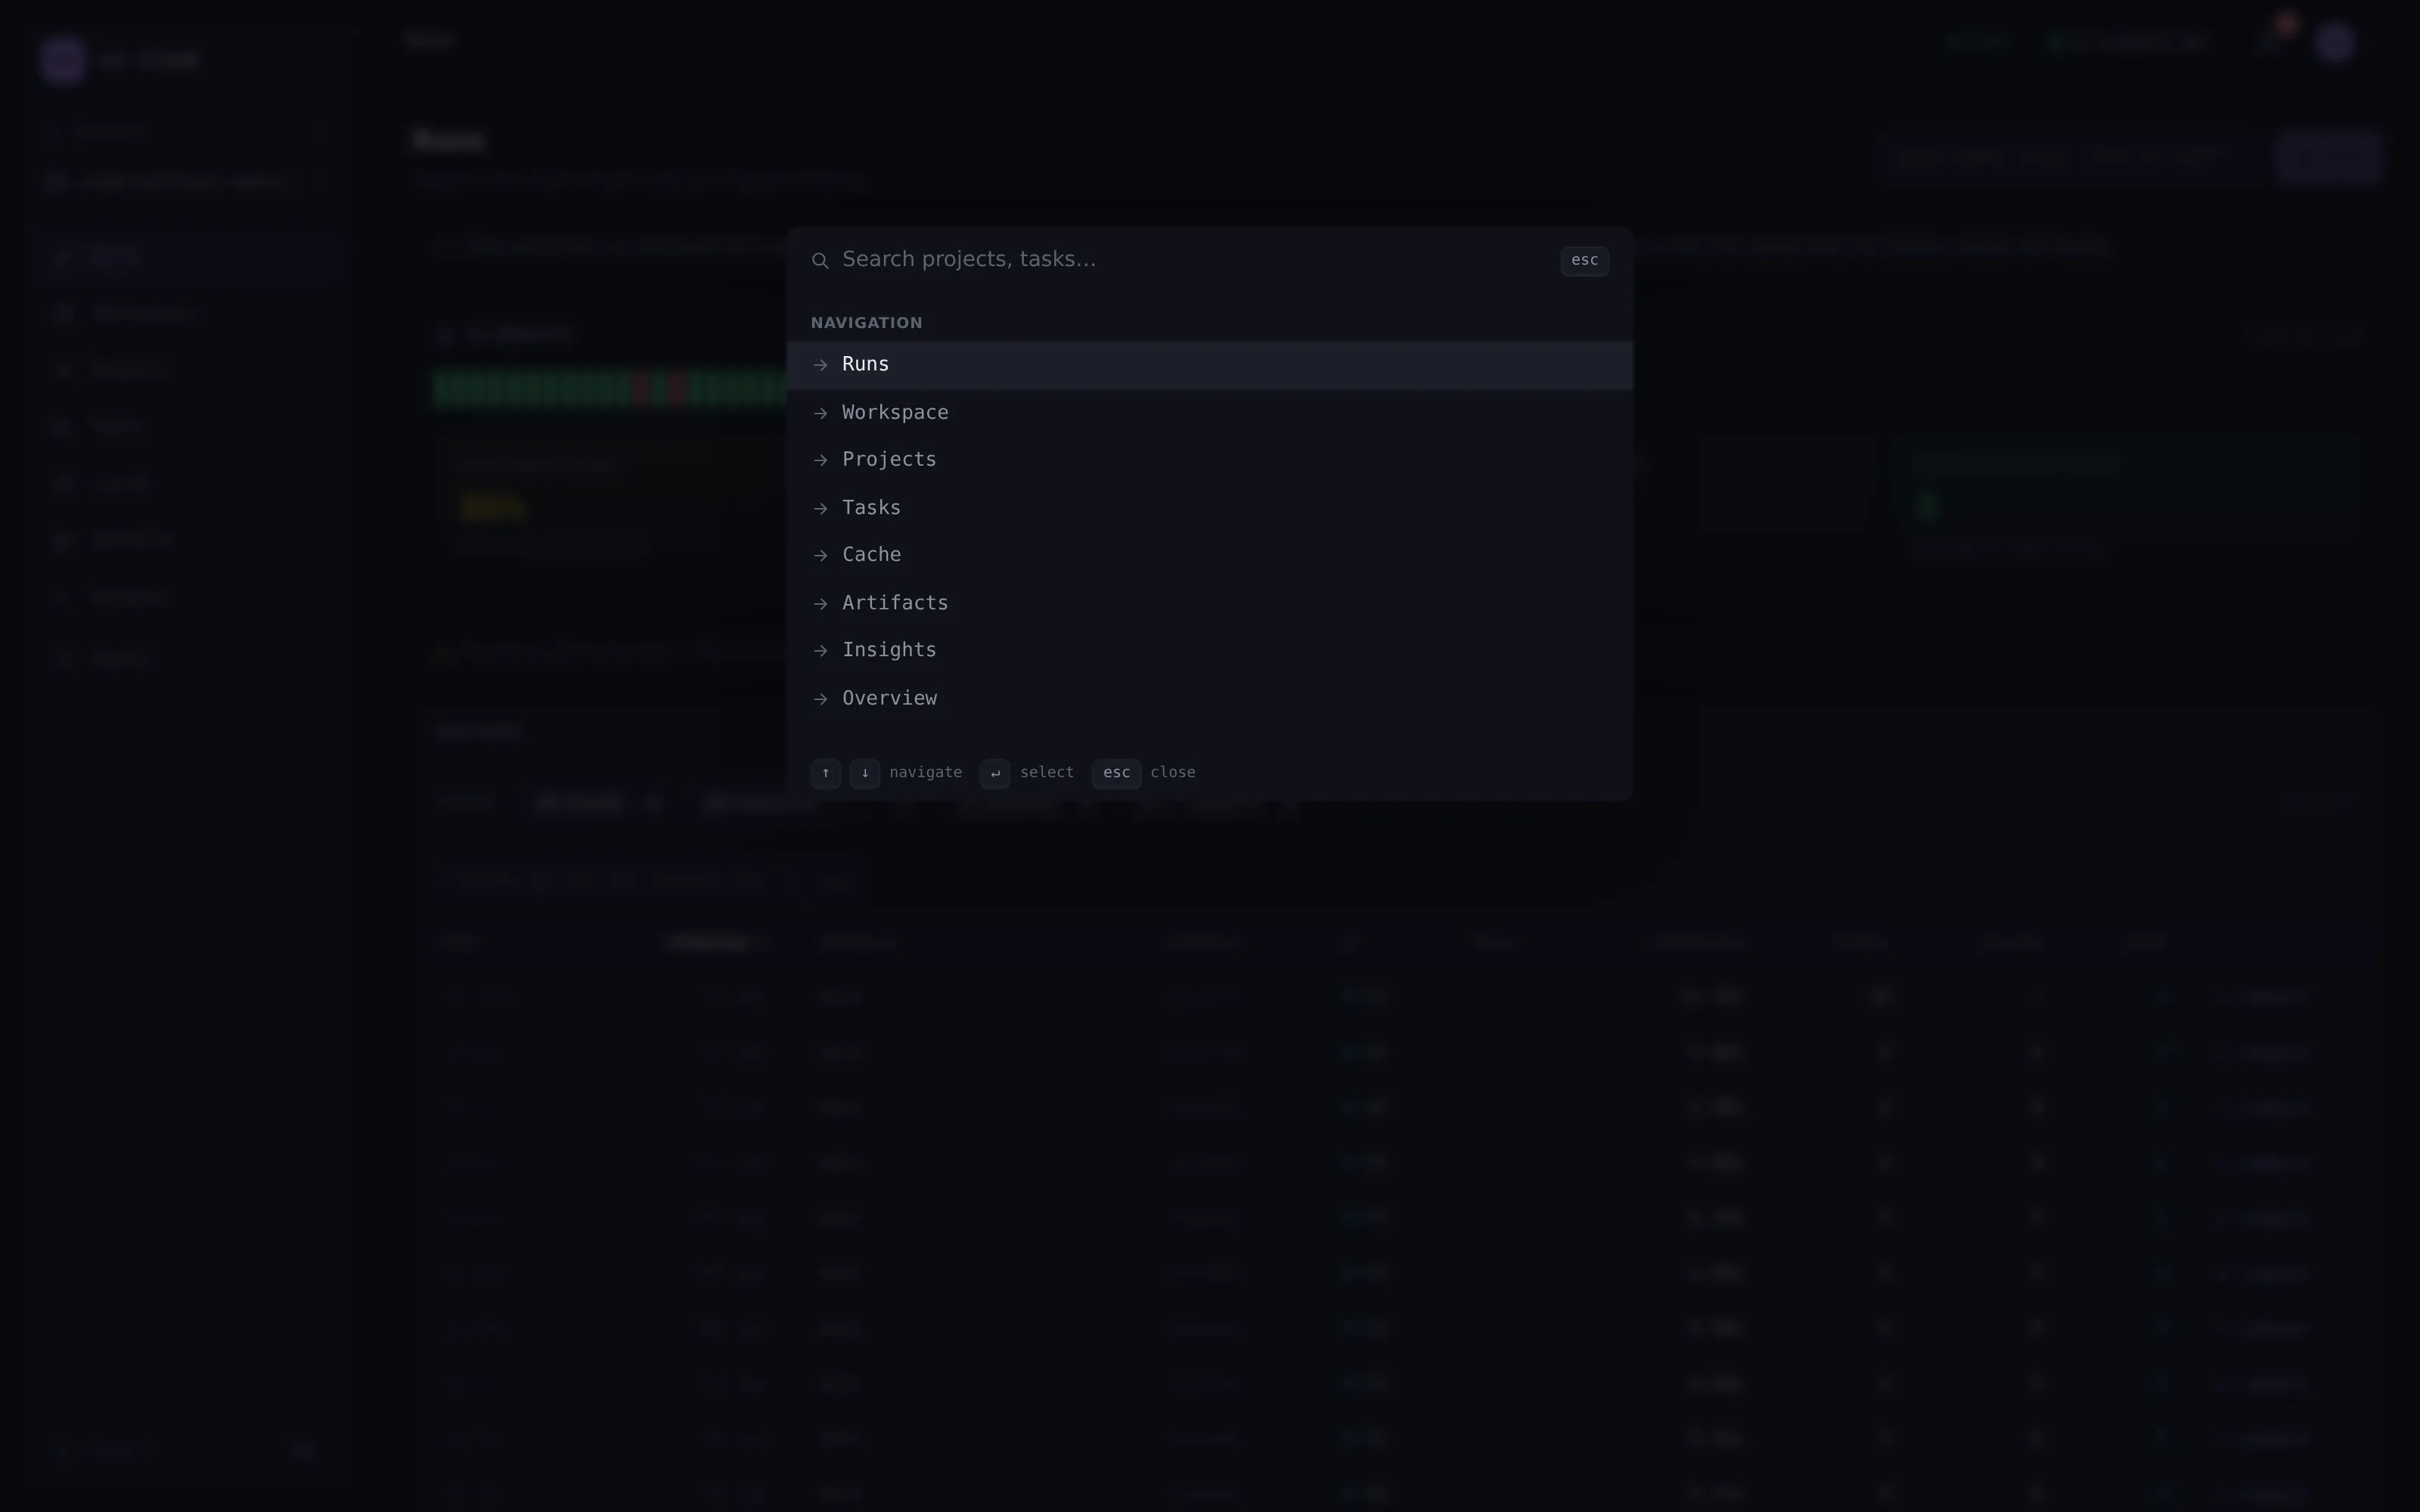
Cmd/Ctrl-K opens a command palette that searches every destination —
pages plus your projects and tasks by name — so you jump straight to the entity
you care about without hunting through the nav.
Accounts, orgs, and access
Section titled “Accounts, orgs, and access”The platform is account-based. You register or log in; the first account ever registered becomes the instance admin, after which signup closes and everyone else joins by invite (see Self-host).
- Login establishes a session (an HttpOnly cookie;
SecurewhenVX_CLOUD_BASE_URLishttps://). - A context picker at the top of the sidebar stacks the two scopes every page reads through: the organization (every analytics read is clamped to it) over the workspace. It is always shown — one workspace is named just as plainly as ten, and an org with none says so rather than rendering empty pages with no explanation.
- Workspaces are provisioned automatically the first time a repo pushes a run (keyed by the repo’s git remote), or created by an admin under Admin → Workspaces. Picking one rescopes every surface — runs, projects, tasks, cache, insights — to that workspace; the selection is remembered per browser. Opening the picker re-reads the list, so a repo that reported for the first time since you opened the tab shows up without a reload.
- An auto-provisioned workspace takes its name from the pushing client, so it can be born with a name you didn’t choose. Admin → Workspaces lets an admin rename one (later pushes never overwrite it) and delete one created by mistake. Delete is not reversible: it removes every run, task result and log the workspace ever recorded, plus its projects and any workspace-scoped API token — so it asks you to type the workspace’s slug to confirm. Its cached artifacts are then swept from object storage (both trust tiers and every per-PR sub-scope); that sweep is best-effort and runs after the delete, so a bucket that is unreachable at that moment leaves the bytes behind — unreachable, as before. The cache an org-wide token shares across workspaces is never touched. Deleting the workspace you’re currently viewing drops you onto a surviving one.
- The Admin area (for
owner/adminroles) manages organizations, workspaces, members (rolesowner,admin,member,viewer), invites, and API tokens (vxc_, atrusted/untrustedtier, optionally workspace-scoped). The tokens you mint here are what CI andvx runpresent. - Invites are single-use and expire after 7 days, and are accepted
two ways: a new person opens the invite URL and the login gate’s
create-account form registers them straight into the org; an
existing signed-in user joins from in-app (“Join with an invite”,
pasting the
vxi_token). Of two racing accepts of one invite, exactly one wins. - The account menu (avatar, top-right) shows who you’re signed in as and links to Settings and (for privileged roles) Admin.
- Settings (
/settings) is your personal account area: rename yourself under Profile, and change your password under Security.
Notifications
Section titled “Notifications”The bell in the header surfaces the current workspace’s recent broken builds — the runs where a task failed — newest first, each linking straight to that run. An unread badge counts failures you haven’t looked at yet (tracked per browser, per workspace); opening the panel clears it. It polls lightly and pauses while the tab is in the background. Cross-branch regressions and flaky tasks are analytics, not per-event alerts — they live on Insights, one click away from the panel.
Where the data comes from
Section titled “Where the data comes from”The dashboard reads from Postgres (run/task history and analytics) and
the S3 artifact store — never a developer’s private cache.db. Runs
land in Postgres via the cloud() plugin: each
executed task is pushed as it finishes (POST /v1/ingest/task, result +
log tail), so a run’s detail page fills in live while it’s still
running, and the run’s summary is pushed at the end (POST /v1/ingest)
as the completeness backstop. A run appears on the dashboard only after
a cloud()-enabled vx run pushes it; a fresh deployment with no
pushes shows empty views — that’s expected.
Because the platform holds no workspace checkout, the dashboard is an analytics + cache surface: you dig into runs that already happened, not spawn new ones from the browser.
Multiple workspaces
Section titled “Multiple workspaces”An org can hold many workspaces. Each has a stable id (derived from the
client’s git remote) and is provisioned on first push (or from Admin).
Every analytics read scopes to a workspace via ?ws=<id>, and the sidebar
context picker chooses which one — see
Accounts, orgs, and access.
The scope travels with the link. The selected workspace rides the URL
hash on every page (#/runs/<id>?ws=<workspace>), so a link you paste to a
teammate opens against the workspace you were reading, not whichever one
their browser last used. Your own selection is still remembered per
browser; a link simply wins over it. If the link names a workspace your
account can’t see, the dashboard falls back to one you can and says so —
rather than quietly showing you different data than the link intended.
Switching workspaces updates the address bar immediately, so it is
shareable the moment you switch.
What you see
Section titled “What you see”The surfaces auto-refresh on a short interval so new runs and metrics
appear without a manual reload. Previously-loaded data stays on screen
during a refresh — only the first load shows a skeleton. A command
palette (Cmd/Ctrl-K) searches every destination — pages plus
your projects and tasks by name — and keeps the retired route names
(Trends, Bottlenecks, Overview) searchable, landing them on their
successors.
- Runs — the run history landing: every
vx runinvocation with branch / commit / CI / tags columns and per-row links to run detail and compare. A CI-health strip shows the last ~24 runs as status ticks plus health tiles (pass rate, flaky-task count, cache hit rate, non-hermetic-key count), each tinted by threshold and linking to the entity that explains it. A “My projects” strip shows the projects you’ve starred (the pin star on any project page or the Projects table — persisted in this browser per server + workspace): each pin renders with its live state (red with the count of tasks currently failing on any branch, green otherwise) and links into the drill-in. Pins also float runs that broke your projects to the top of the notification bell, marked with a star. Faceted filters (result · branch · project · commit) narrow the history and persist in the URL hash (#/runs?result=failed&branch=main), so a filtered view is shareable and restores on load. - Run detail — a per-task table (CPU + peak RSS + hash), a graph / flame toggle (the dependency graph view needs a colocated workspace to reconstruct edges, so on the platform the card auto-falls back to the flamegraph timeline — and when a run recorded no per-task timeline, the flame switches to honest duration bars, longest first, instead of drawing a fabricated timeline), a failed-task triage card answering “is this failure mine?” for every failed task — flaky (the same cache key succeeded in other runs), already broken (the default branch’s latest run of the task also fails — inherited), or new failure (first failure of this key, noting whether this run changed the task’s inputs) — each with a link to the evidence run, and a “why did this re-run?” card naming the exact cache-key components that changed since the previous run. Select a task to open its panel — including the task’s captured log tail (the last 128 KiB of merged stdout+stderr), so you can read a failed task’s output without leaving the browser. A cache-hit task shows the output from the run that produced it (resolved by hash), plus an artifact download when the store holds it.
- Compare — diff a run against its immediately previous invocation (per-task duration deltas, status / hash changes).
- Workspace — the workspace entity page: identity and links into the other areas, plus per-workspace rollups.
- Projects / Tasks — per
(project, task)analytics: runs, success rate, hit rate, avg/p50/p99, and a trend row (this window vs the prior equal-length one, with signed deltas — “did MY project/task get faster or slower?”). A task detail adds a Debug card (one-click jumps to the last failed run with logs pre-opened, the latest run, and the latest artifact), a flaky badge, and a Recommendations card that turns flaky / hermeticity / caching signals into concrete config fixes (each with a copy-pasteable snippet). Insights also ranks the least stable tasks workspace-wide, and the Compare view judges each duration delta against that task’s measured noise floor rather than a fixed threshold — a delta inside the margin of error renders neutral, because nothing smaller than a task’s own variance can be called a change. Every task with a repeated cache key gets a Stability card: the spread of durations measured across executions of identical inputs — typical and widest ±1σ, the min→max range, and a per-key breakdown. Identical inputs cannot regress, so that spread is the task’s margin of error, not a performance change; it is also the floor under any cross-key comparison, and the Compare view renders a same-key delta as magnitude only, passing no verdict on it. A flagged task also gets a Flakiness trend card — flaky episodes per day over the last 90 days (retried successes + failures whose cache key also passed) with first-seen / last-episode timestamps and a worsening / improving / steady verdict, answering “when did this flake start, and is it getting better?”. A healthy task shows no card. - Project detail — a single-dev drill-in for a project you own, all
windowed by the same timeframe selector (24h · 7d · 30d · 90d,
persisted in the URL). Task duration trends draws a per-task
sparkline of average executed duration over the window — spot the
outlier or the task that spiked, colored by direction (slower = red).
Failures & runs over time charts the project’s runs / hits /
failures per bucket. How this project ranks compares it against
every other project on three axes (failure rate, average exec time,
hit rate) with your project highlighted at its true rank. Where
failures were first noticed — across branches names, for each failing
task, the branch it first started failing on, when, and the commit —
so you know whether
mainbroke or a feature branch found it first. The lifetime task table gains a Δavg column (each task’s period-over-period average delta), and Recent executions lists the project’s last runs — a row opens the run with that task’s logs, the hash opens the cache entry. - Cache — hit-rate split (local vs remote), estimated time saved, storage by project (which projects’ artifacts occupy the store), a storage-growth chart (last 30 days), and the entries table (hash, task, size, age, last hit). Each entry’s hash opens the cache-entry page: the entry’s facts, its artifact download, and every run that produced or restored it — the provenance chain for one cached result.
- Artifacts — the S3 artifact store made visible: every artifact your principal may read (trust-scoped), with size/age/tier, best-effort task/run provenance links, and authenticated downloads.
- Insights — the analytics area, windowed by a timeframe selector
(24h · 7d · 30d · 90d — persisted in the URL, so a windowed view is
shareable; 24h switches the trend charts to hourly buckets).
Trending tiles compare the selected window against the prior
equal-length one (runs, failure rate, cache hit rate,
average executed duration). A Got slower card flags tasks whose
latest executed run is ≥2× their own p50 (with a ≥100ms floor; cache
hits excluded on both sides) — the active “did something regress just
now?” nudge beside the trend surfaces. A Biggest movers table ranks
tasks whose average duration shifted most, and a Started failing
across branches card names tasks whose most-recent run fails on ≥2
distinct branches — the “what just broke everywhere?” signal. Plus flaky tasks
(with a within-run-retry Retried column and a Suggested fix
column), the Hermeticity card (cross-machine output-fingerprint
divergence from
vx run --force --verify=fingerprintruns — the exact task, platforms, and diverging output files), bottlenecks (Where to invest, with weekly-savings estimates), and recent failures. Activity charts cover runs per day and total duration per day, a When you build heatmap (7×24 build-activity grid), and a parallelism factor per invocation chart — how much of the declared concurrency each run actually used. The cache column of the story lives here too: the hit source split (last 24h), cache storage growth, top time-burners, and a prunable cache entries table (what avx cache prunewould reclaim). Every row links into its entity — a failure opens its run with the task pre-selected.
MCP: the same platform, for AI agents
Section titled “MCP: the same platform, for AI agents”The server exposes POST /mcp — a dependency-free MCP endpoint (JSON-RPC
2.0) behind the same auth, tenant-clamped by org/workspace. AI agents
connect to your deployment and read the same metrics the dashboard shows.
See vx mcp — AI agents.
Task logs: capture, storage, and privacy
Section titled “Task logs: capture, storage, and privacy”Per-task log tails are captured by the cloud() plugin (default on when
connected) and shipped to the platform after each run’s summary. Storage
is bounded at every layer: the last 128 KiB per task, 4 MiB shipped per
run (a failed task’s tail is never evicted to keep a successful one’s),
a 16 MiB request cap, plus an age + byte-ceiling retention on the server.
Cache-hit tasks store nothing — they resolve by hash to the run that
produced the bytes.
Every cap reports itself. A task whose output was trimmed — from the head
by the per-task cap, or entirely by the per-run budget — still appears,
and its log panel says how much was dropped (… earlier output truncated (N KiB dropped)). Only a task that genuinely produced no output reads as
“No logs captured”, so the two are never confused.
Privacy. Log tails are program output and may echo secrets. This is
the same trust boundary the remote cache already crosses (a cacheable
success ships its full stdout to the same platform, under the same token +
trust scoping). Turn capture off with cloud({ logs: false }) or
VX_CLOUD_LOGS=0.
Distributed (VX_CLOUD_DISTRIBUTE) runs appear under Runs and fill in
live too — including per-task logs: the server-side controller that
schedules the run records each task the moment it finishes (with its captured
stdout/stderr tail) and writes the invocation header when the run ends, so a
distributed run reads exactly like a local cloud() run — click a failed task,
read its output — no extra setup.
Known limits
Section titled “Known limits”- Analytics come from pushed summaries. A view is only as complete as
the runs the
cloud()plugin (or the distributed controller) has recorded; a workspace nobody ran from is empty.
See also: Self-host vx-cloud,
Distributed CI execution,
Remote caching.