
Draw the task graph
Export the graph as Graphviz DOT and see what depends on what.
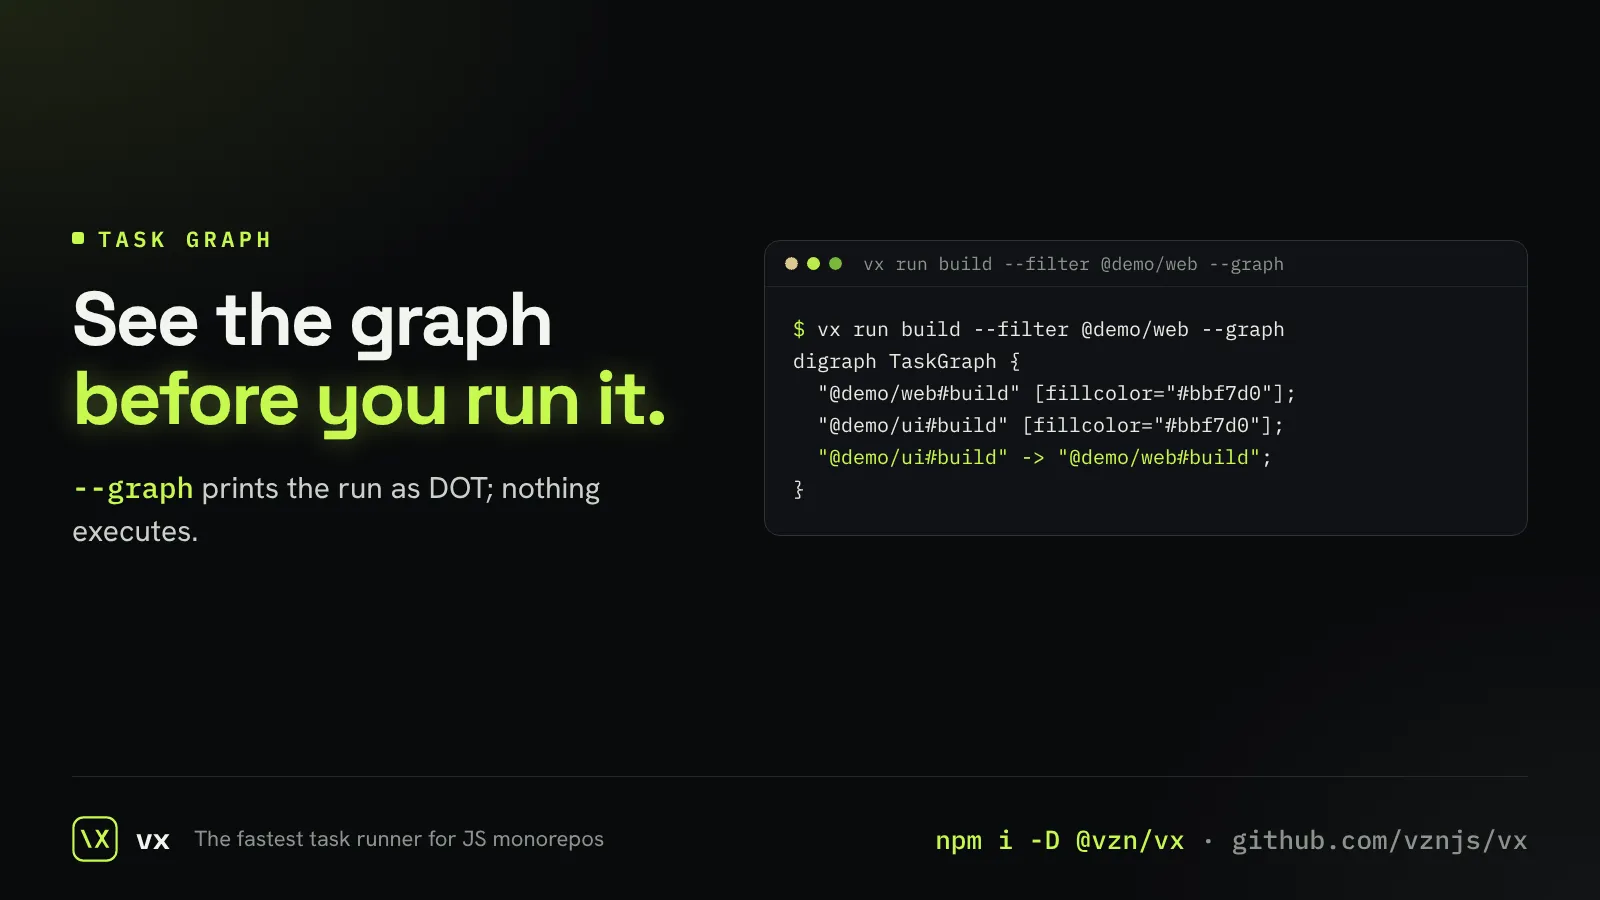
A graph you cannot see is a graph you guess about. --graph prints the tasks a run would execute and their edges as DOT, colored by cache state.
Pipe it to Graphviz for a picture, or write it to a file. Nothing runs.
More in See inside a run
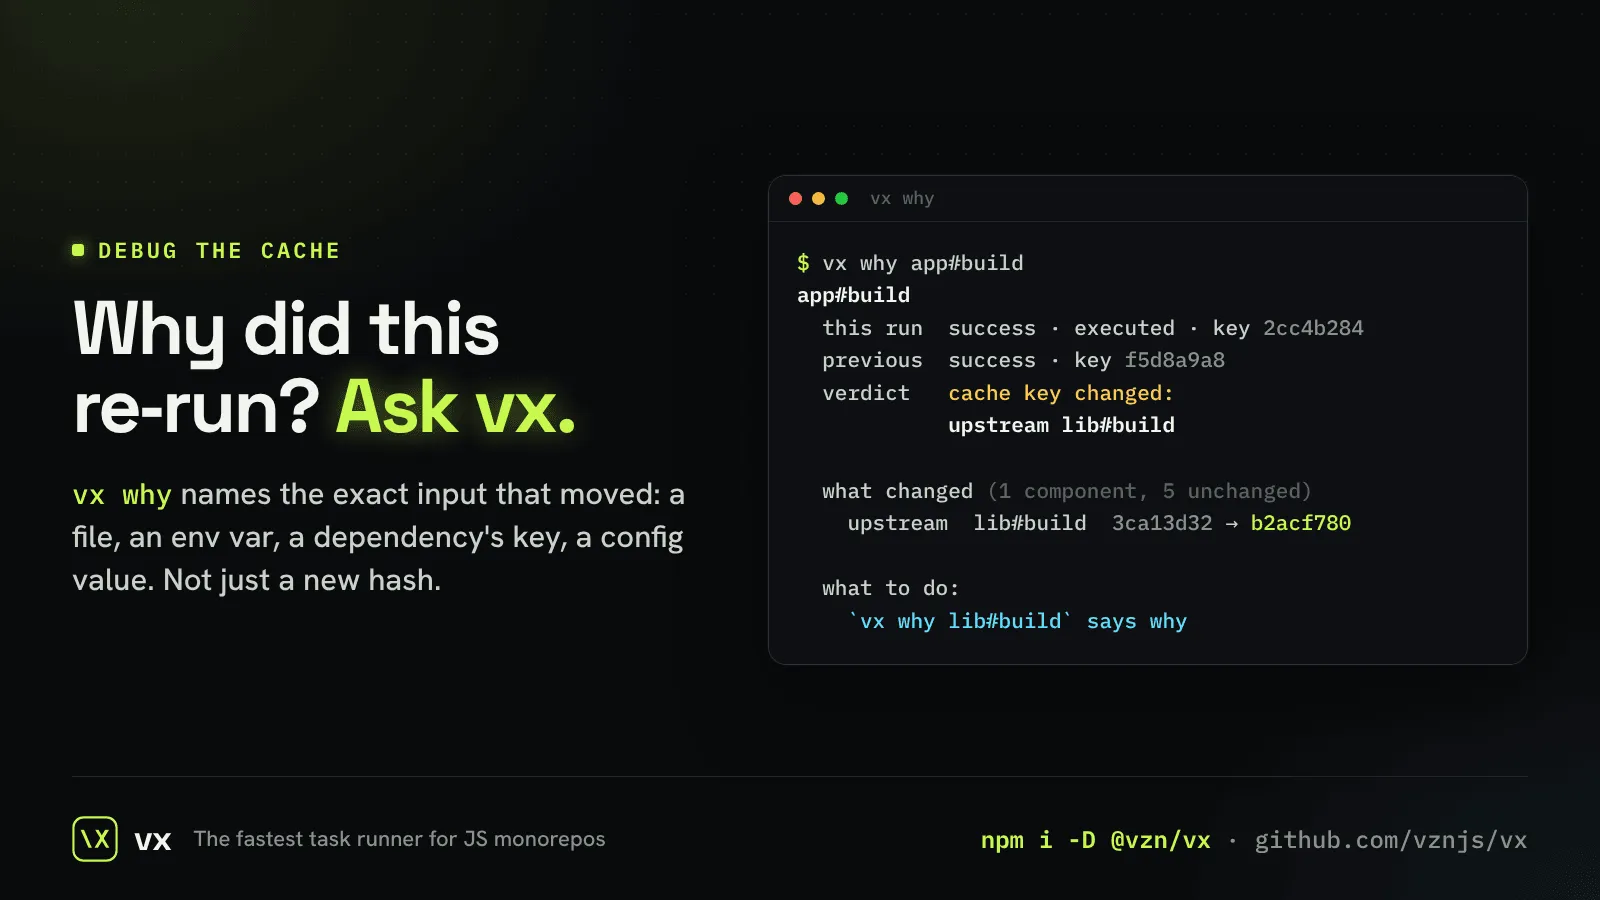
vx why
Ask why a task re-ran, and get the input that changed.
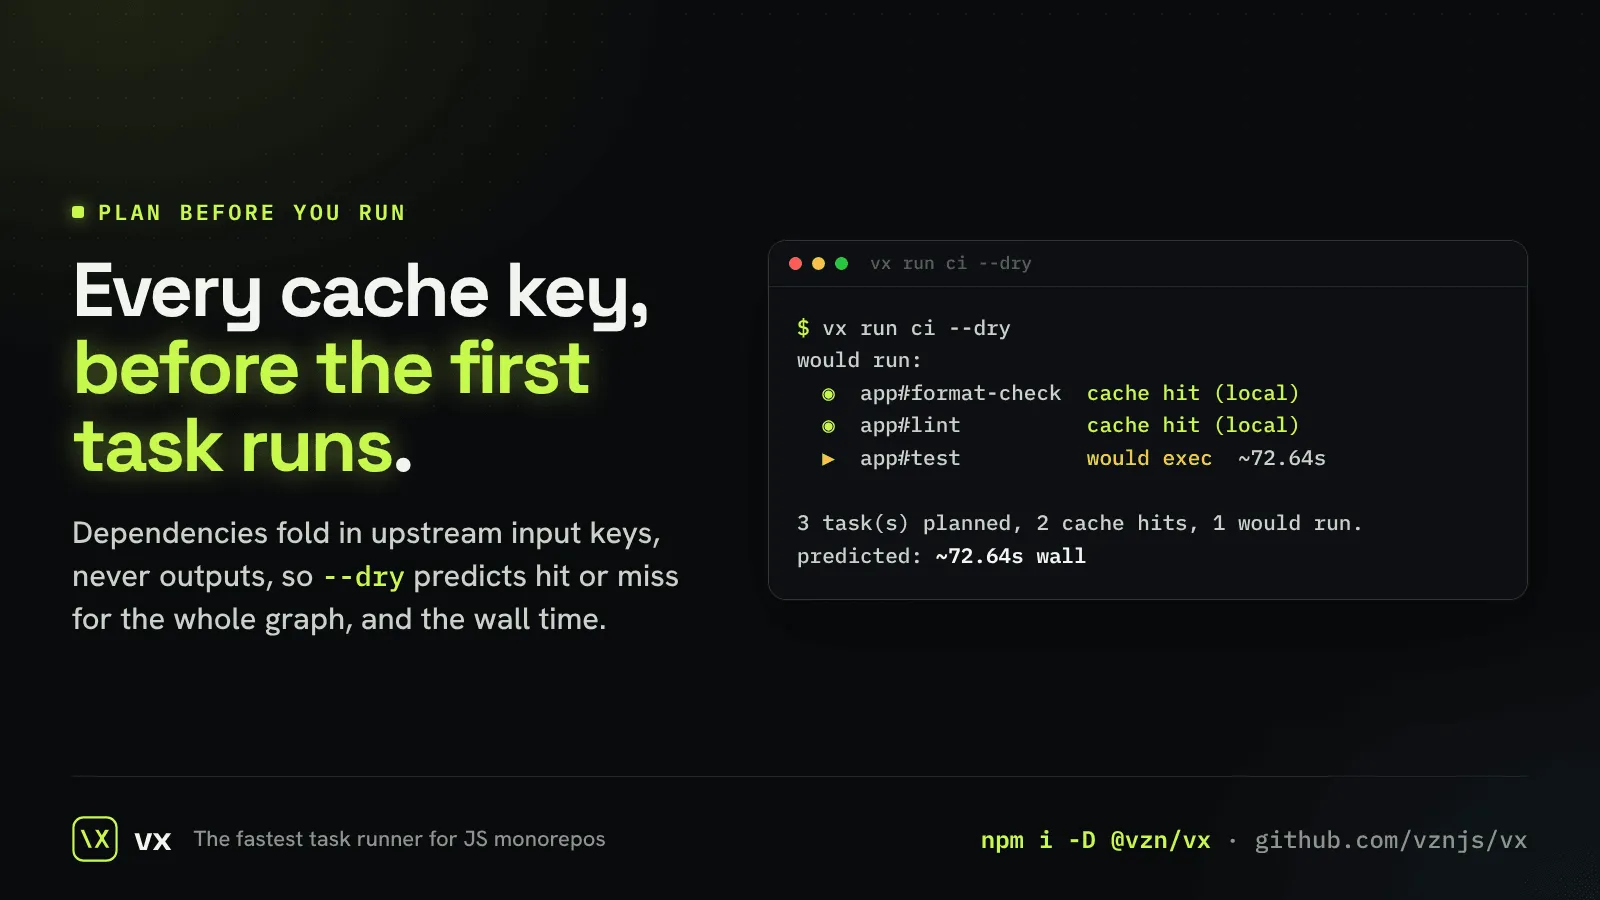
Plan before you run
Hit or miss for every task, before anything executes.
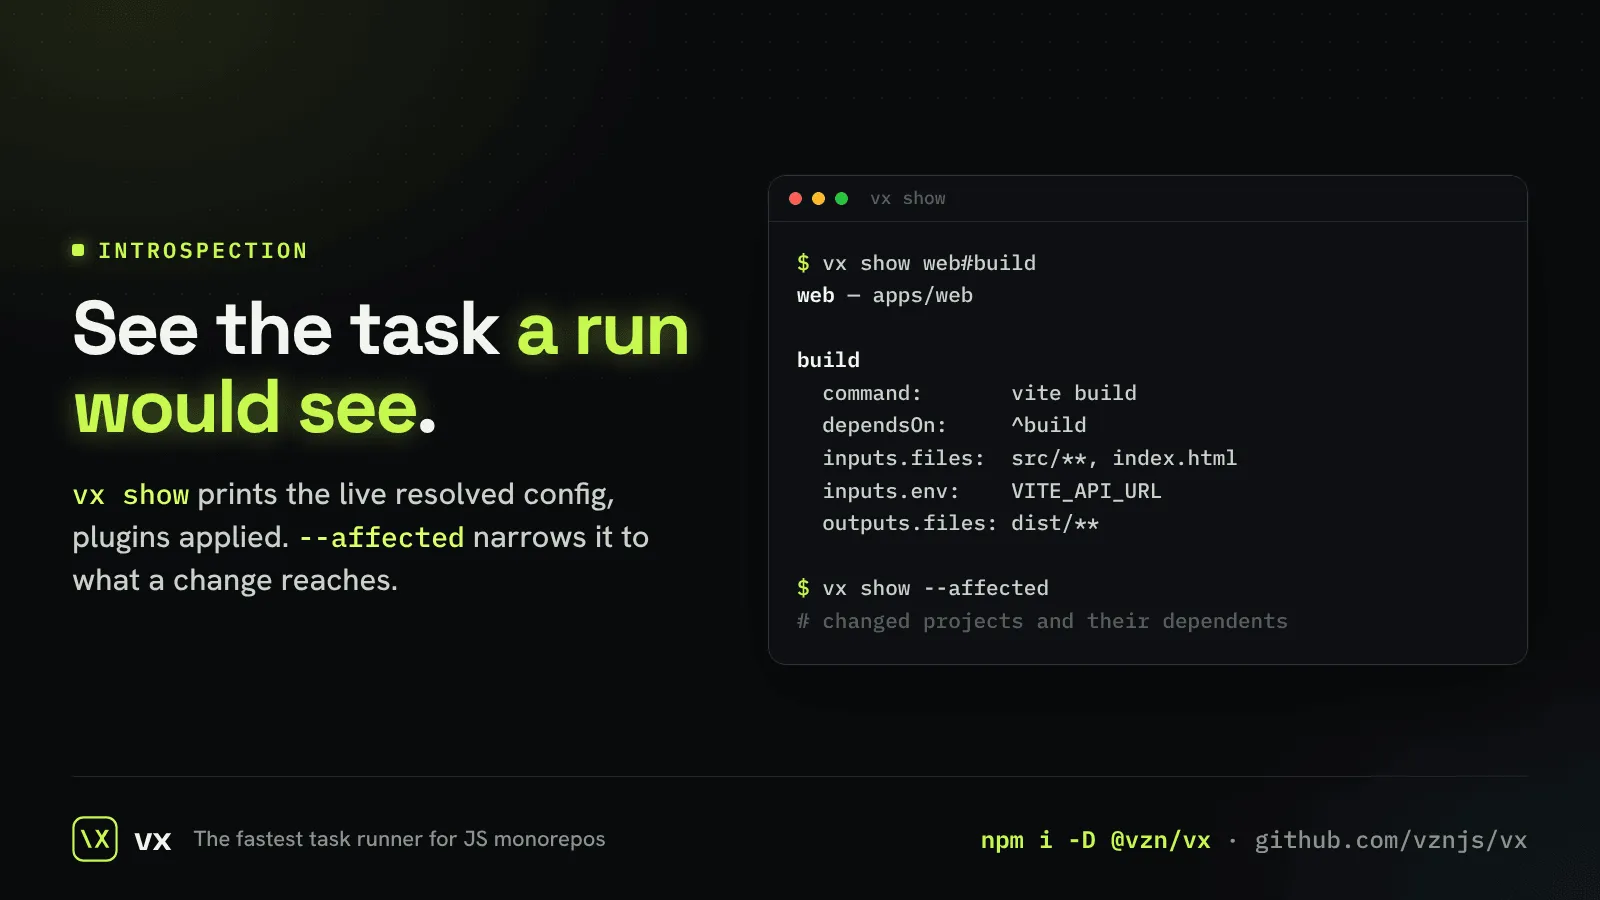
vx show
The task exactly as a run sees it, after every preset and plugin.
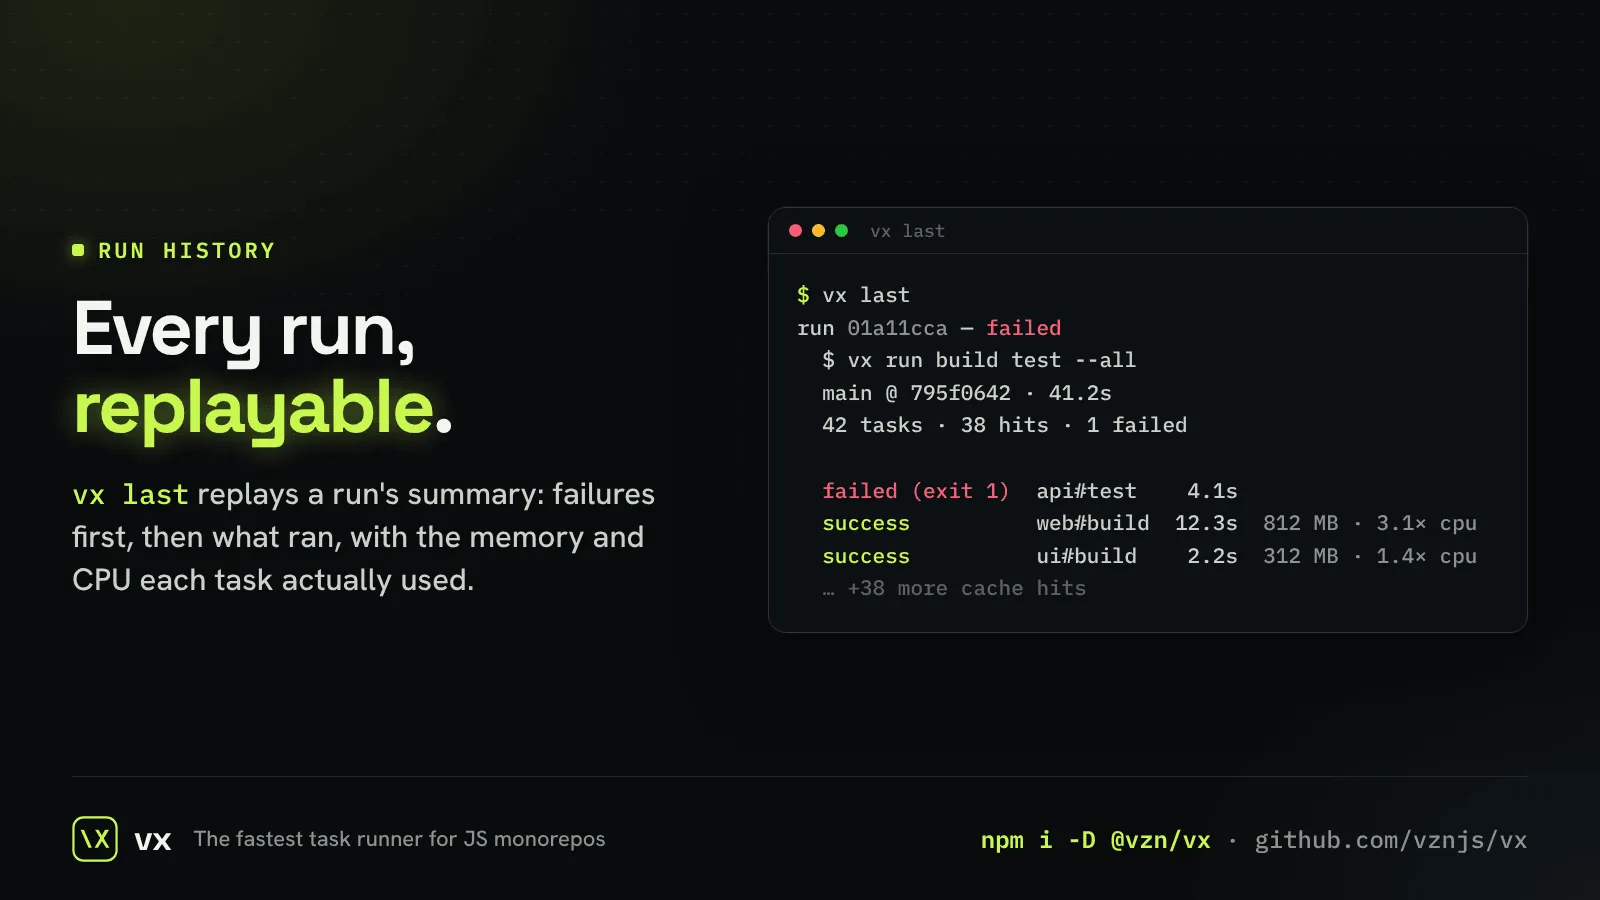
vx last
Replay the last run’s summary, failures first, without running anything.
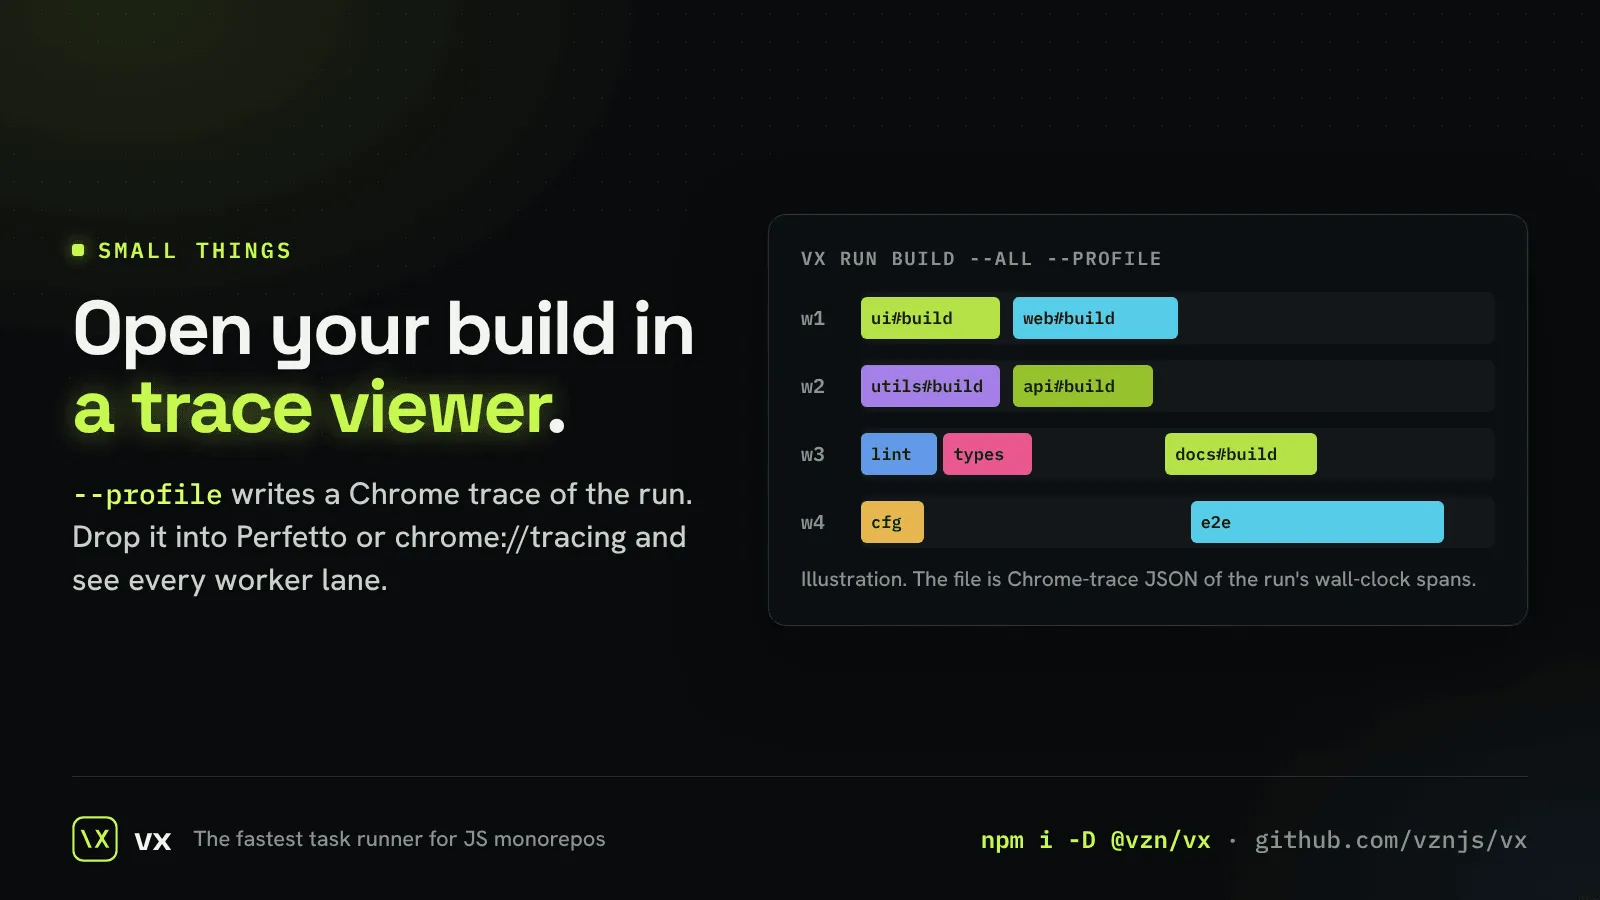
Your build as a trace
--profile writes a Chrome trace of the run.
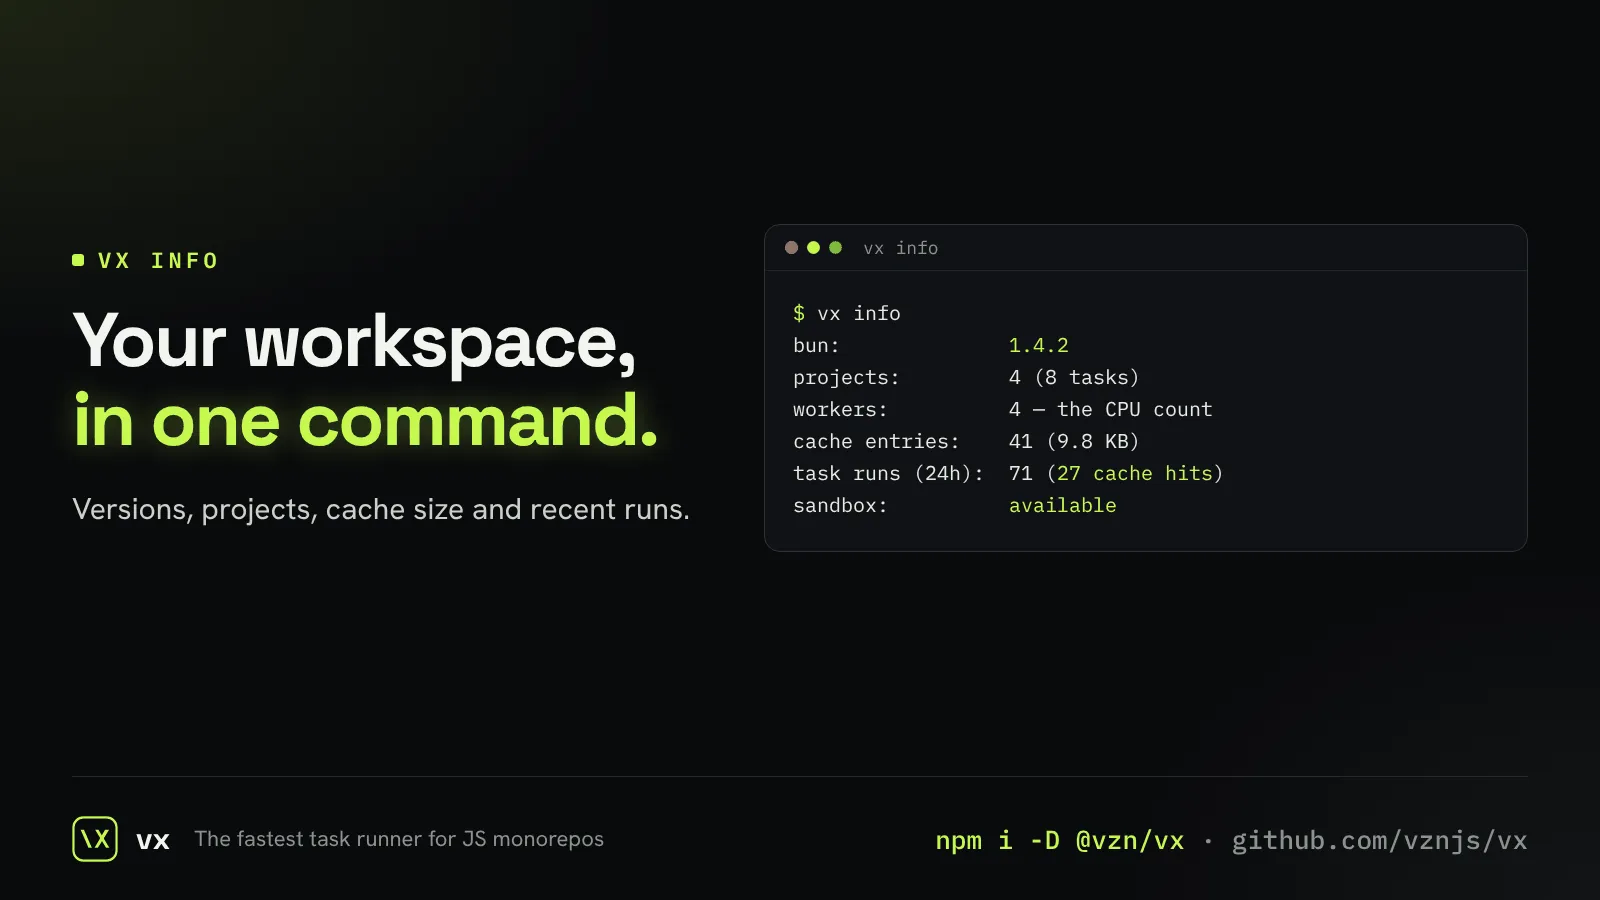
Know your workspace
One command shows versions, projects, cache size and recent runs.
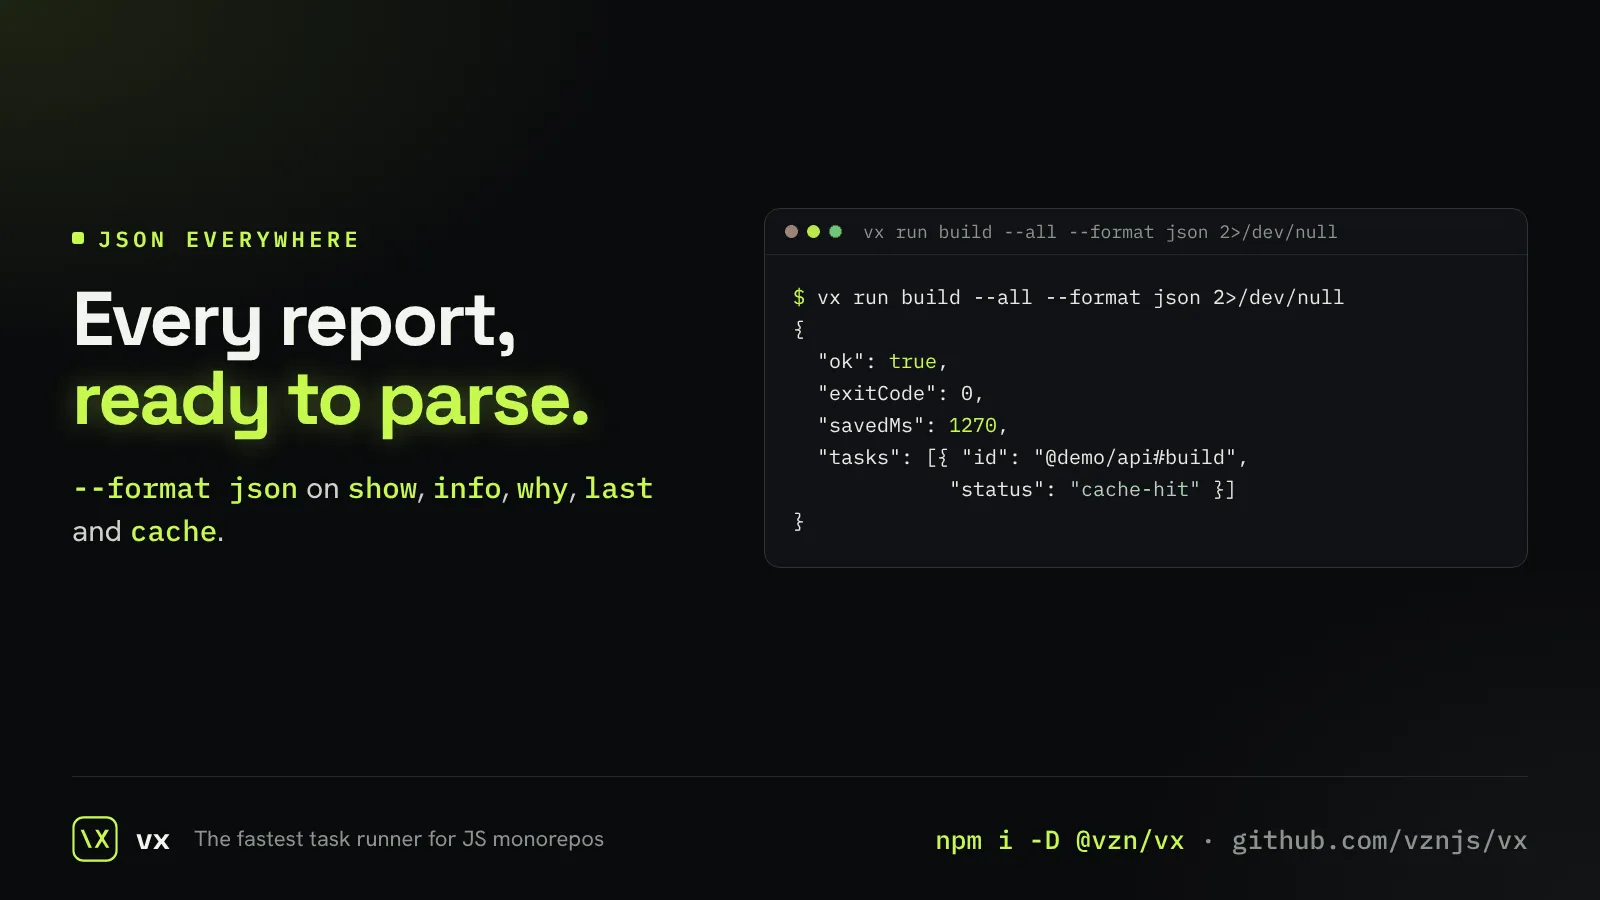
JSON from every report
show, info, why, last and cache all print JSON, so scripts and agents never parse text.
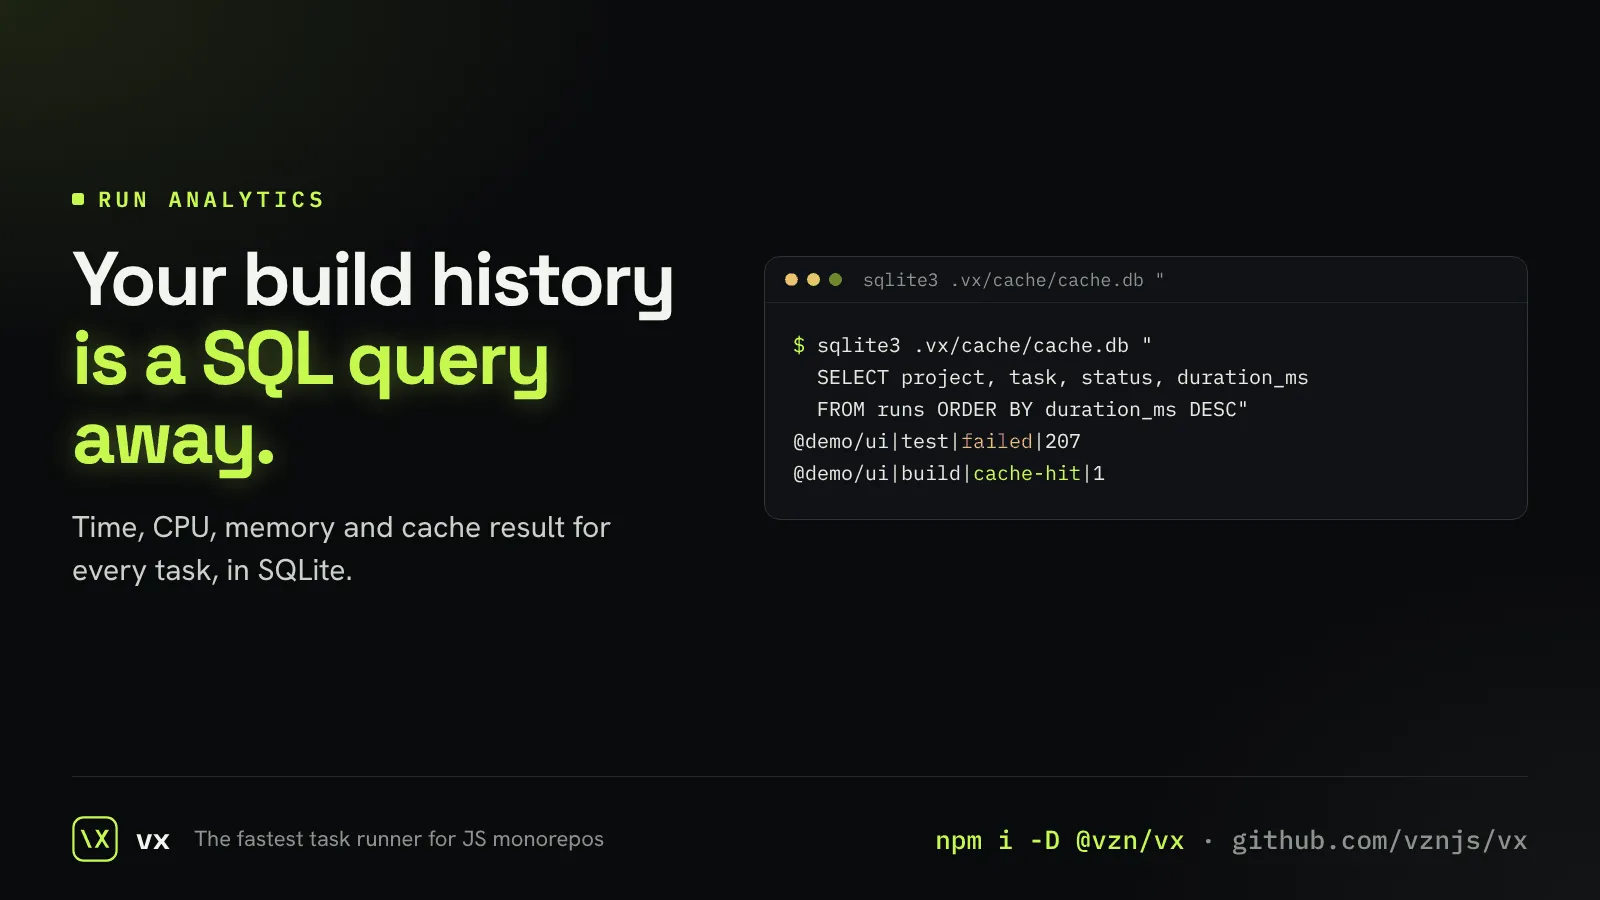
Every run, queryable
Each task’s time, CPU, memory and cache result go into SQLite you can query.
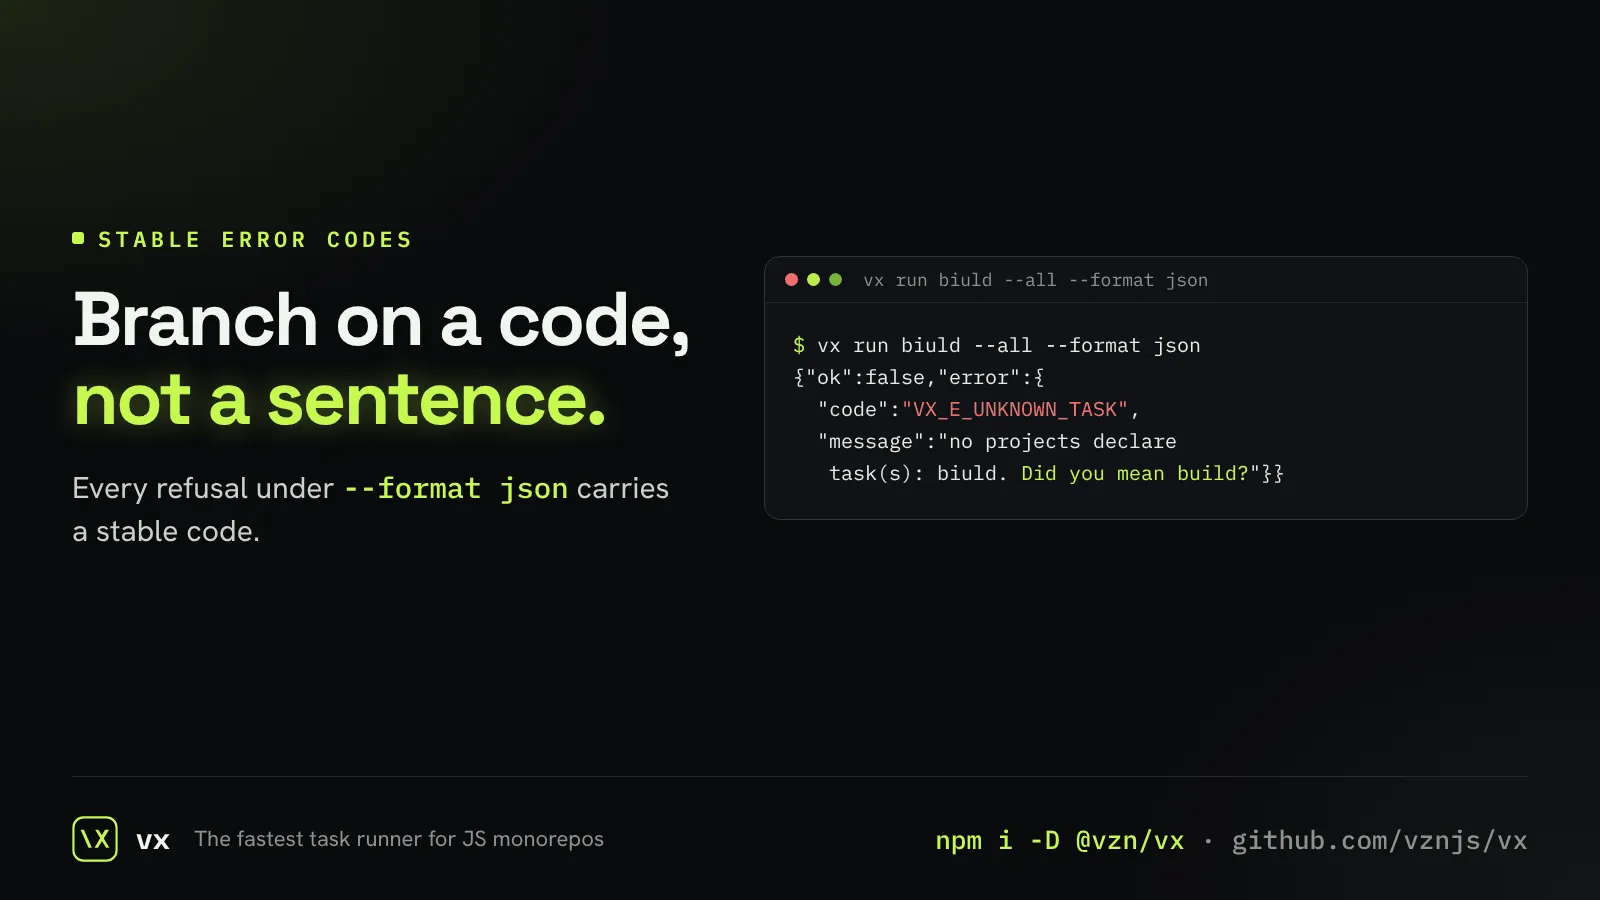
Errors an agent can branch on
Under --format json, a refusal is a JSON line with a stable code.
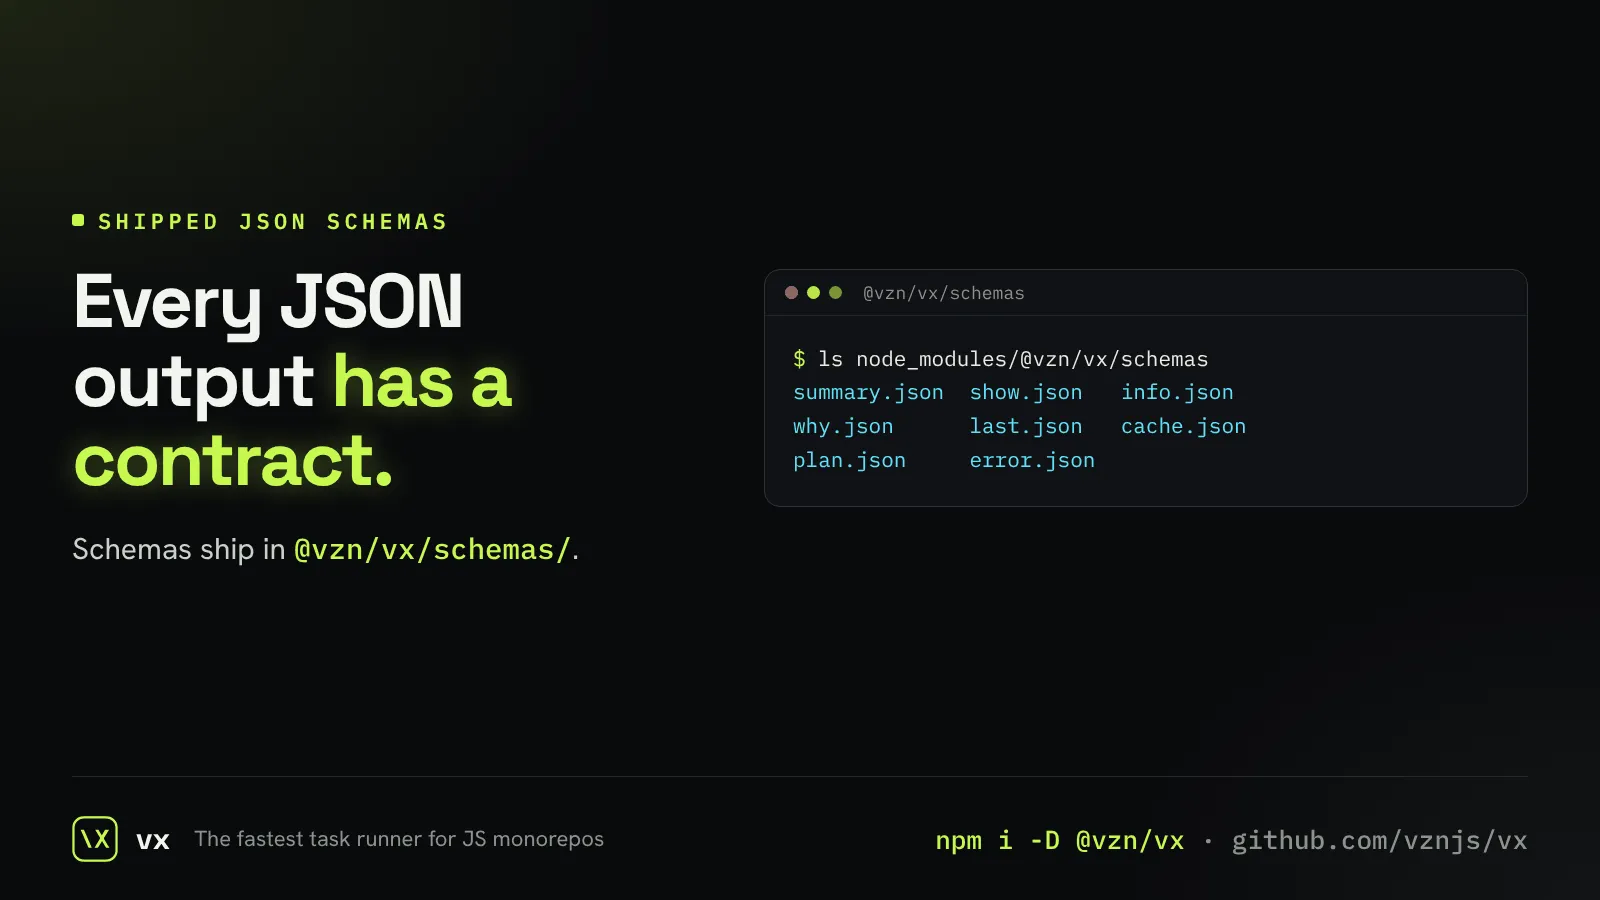
A schema for every JSON shape
Every JSON document vx prints has a published JSON Schema.
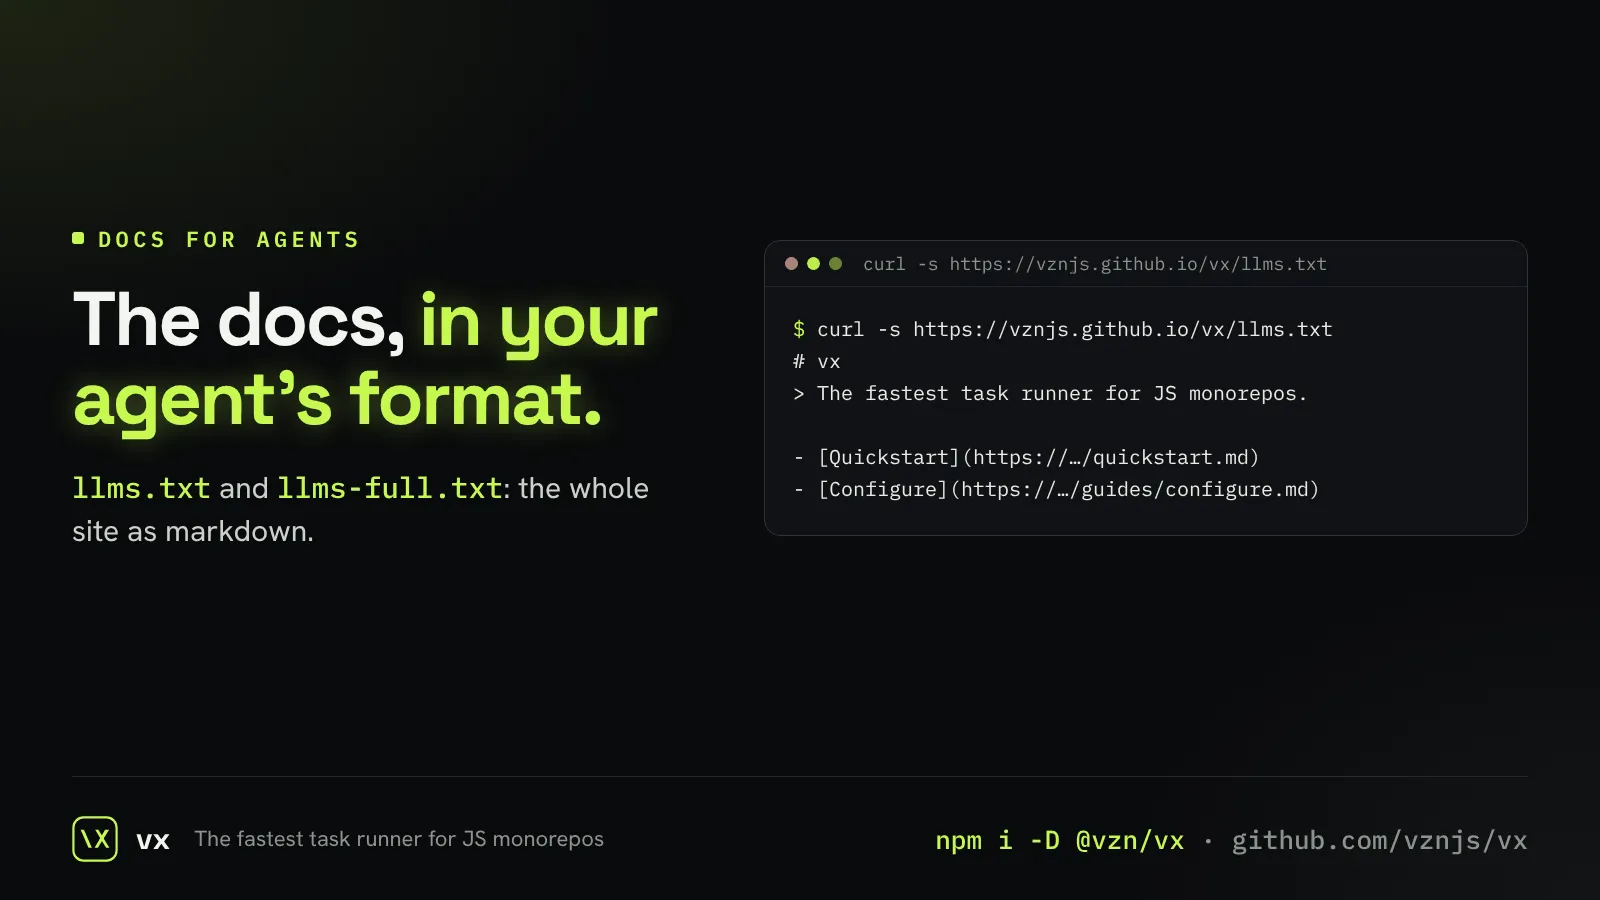
Docs your agent can read
The whole site as markdown in llms.txt and llms-full.txt.
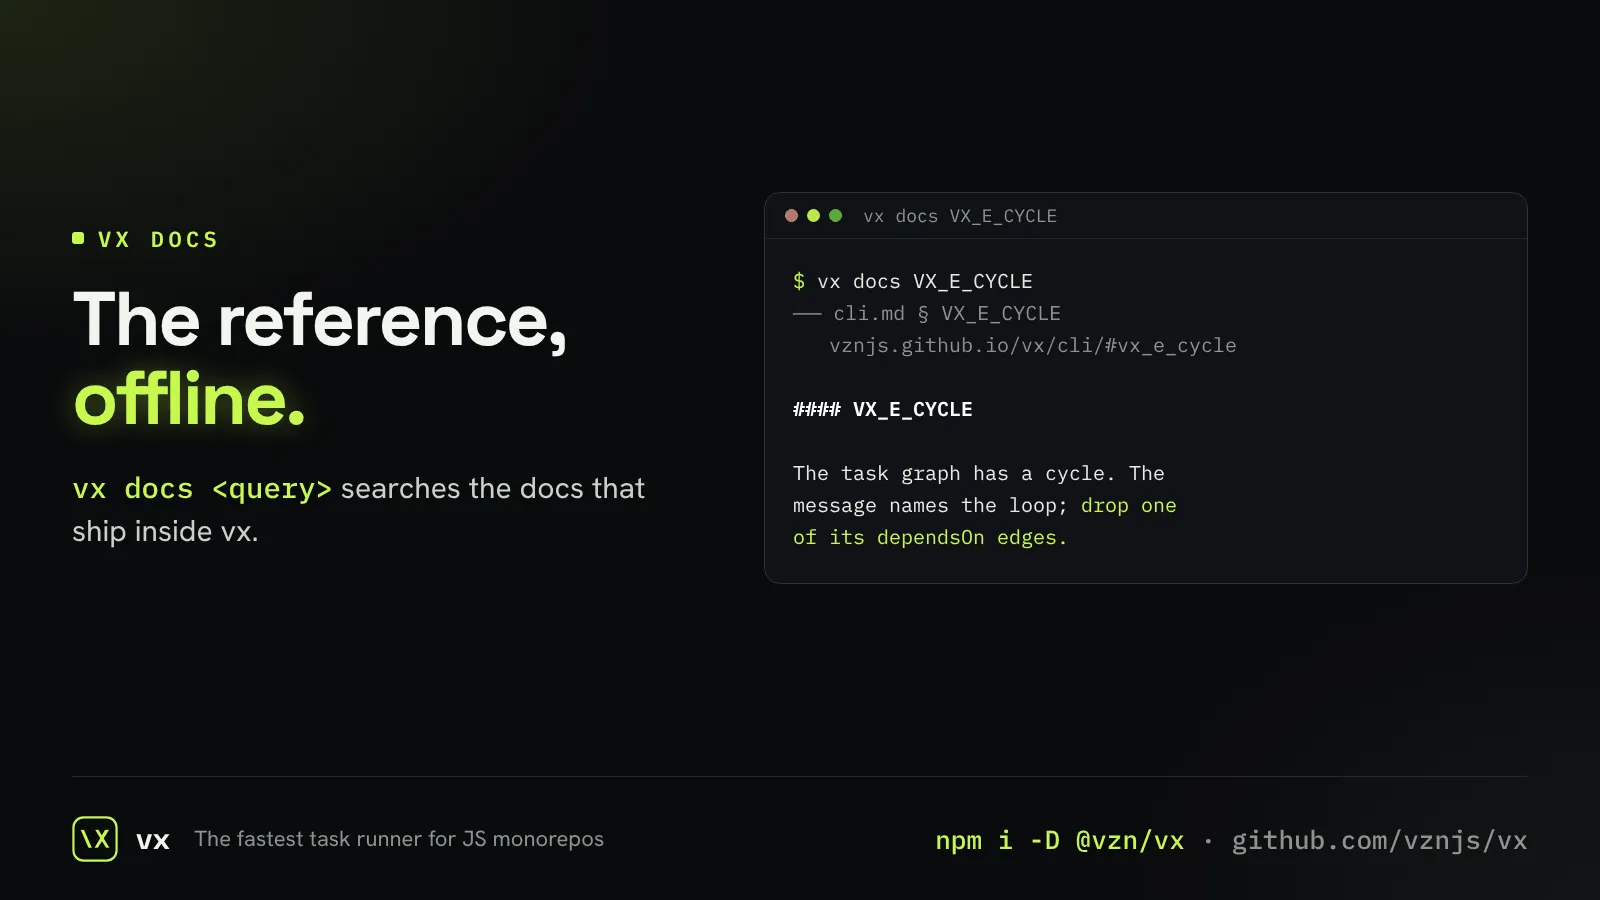
The reference, offline
vx docs <query> searches the CLI, config and cache reference with no network.
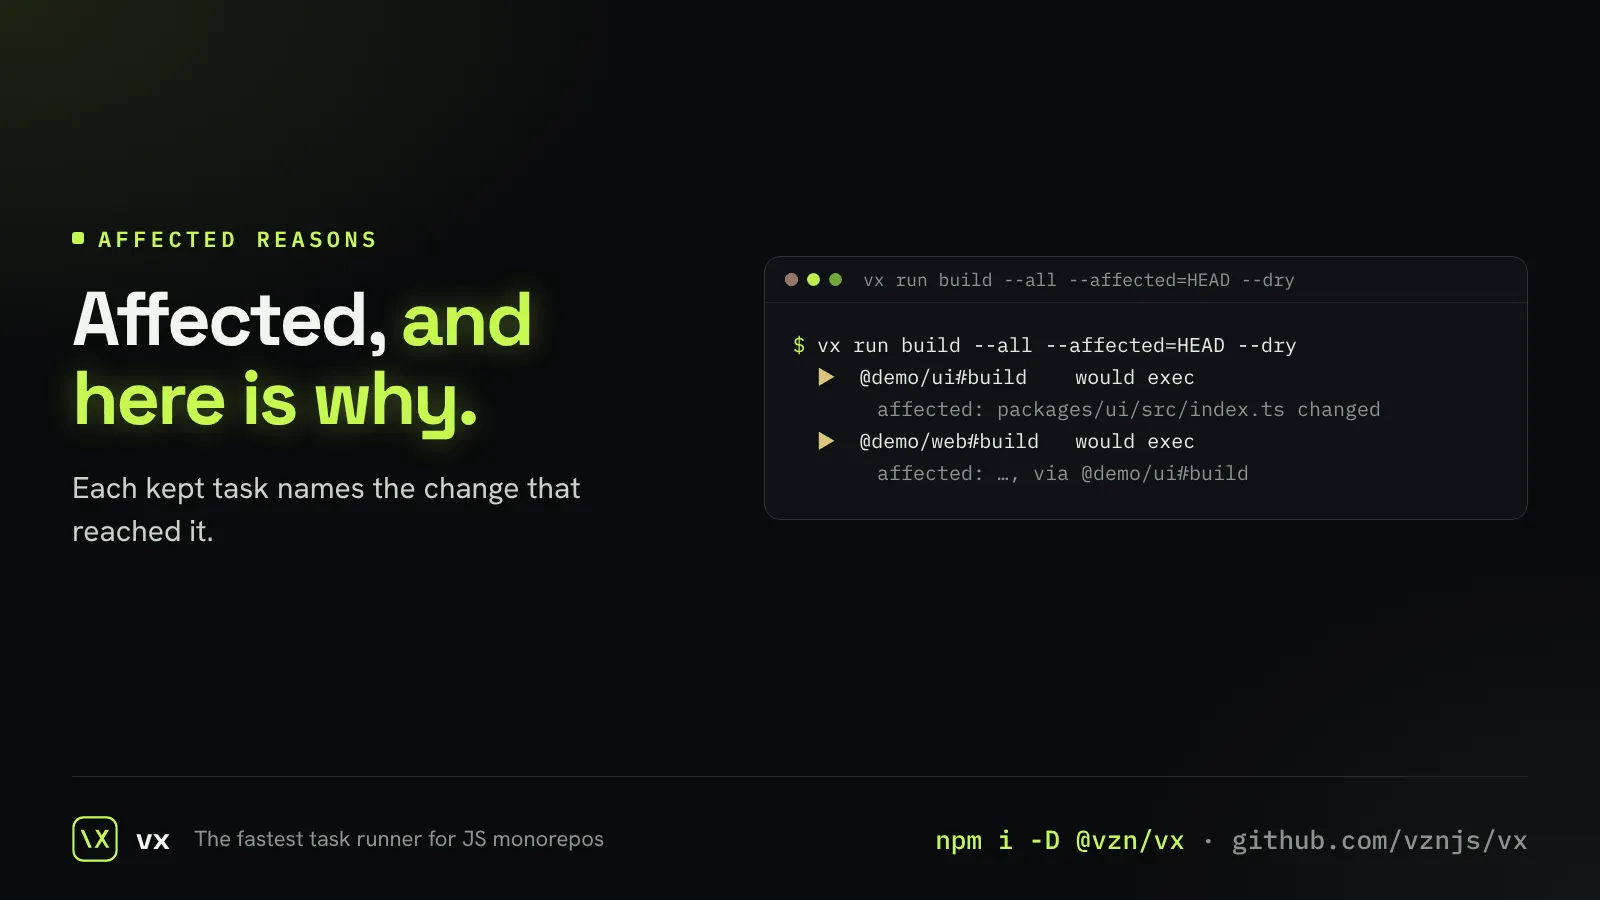
Why a task is affected
Each task --affected keeps says which changed file or dependency brought it in.
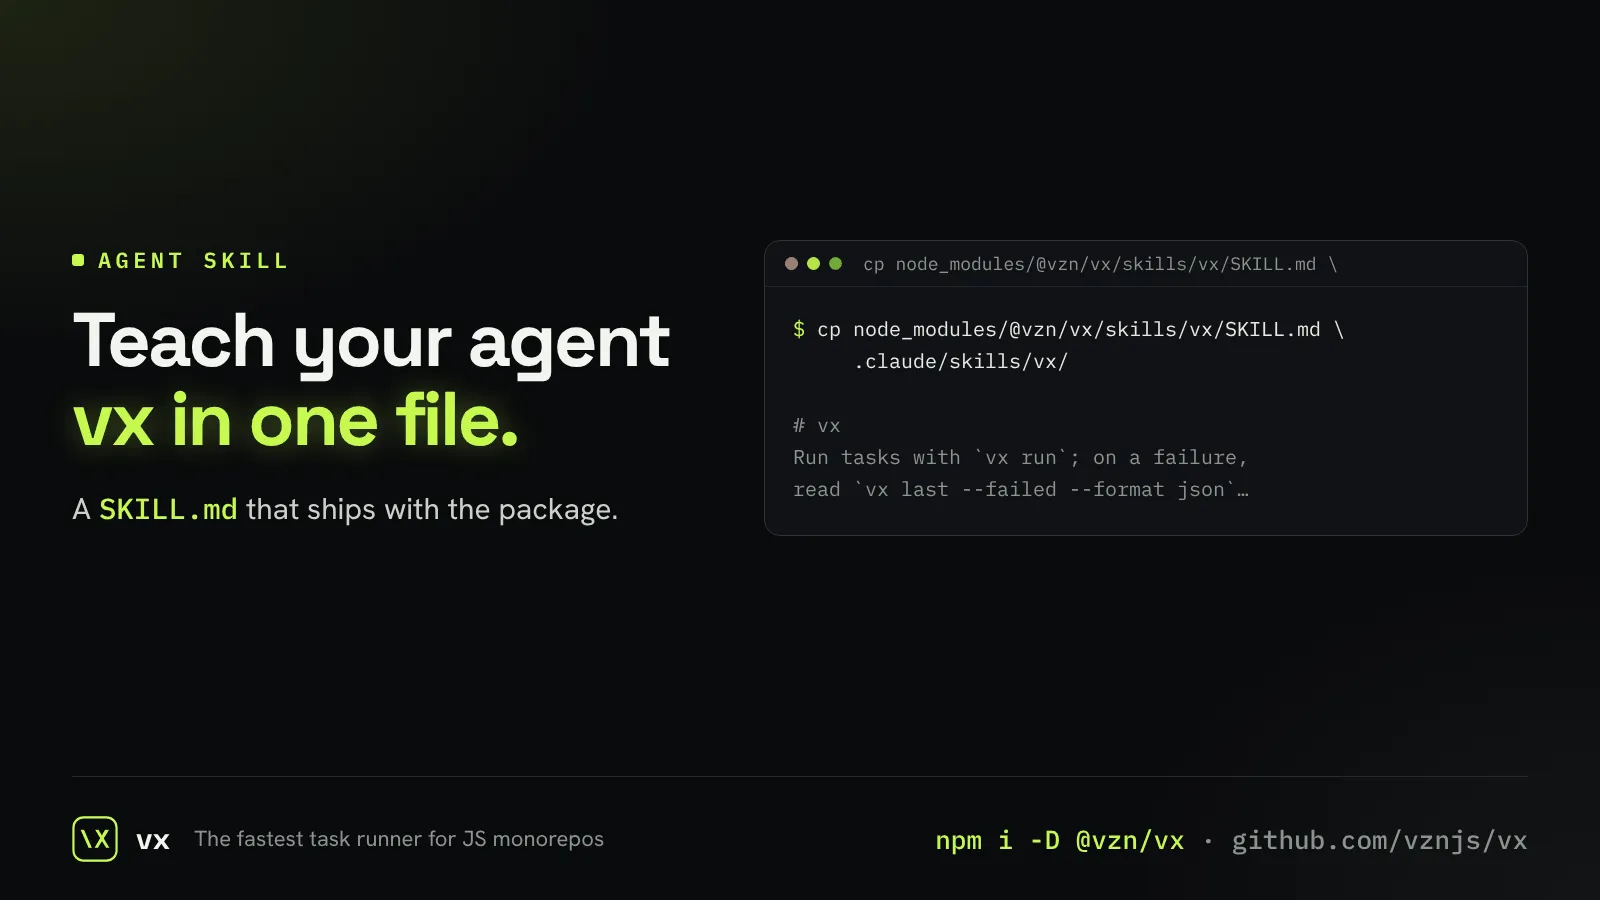
A skill for your coding agent
An installable skill teaches an agent to run, debug and query vx.